. 2000 Oct 1;528 Pt 1(Pt 1):65-77.
doi: 10.1111/j.1469-7793.2000.00065.x.

G protein modulation of recombinant P/Q-type calcium channels by regulators of G protein signalling proteins

Affiliations

G protein modulation of recombinant P/Q-type calcium channels by regulators of G protein signalling proteins

M D Mark et al. J Physiol. .

Abstract

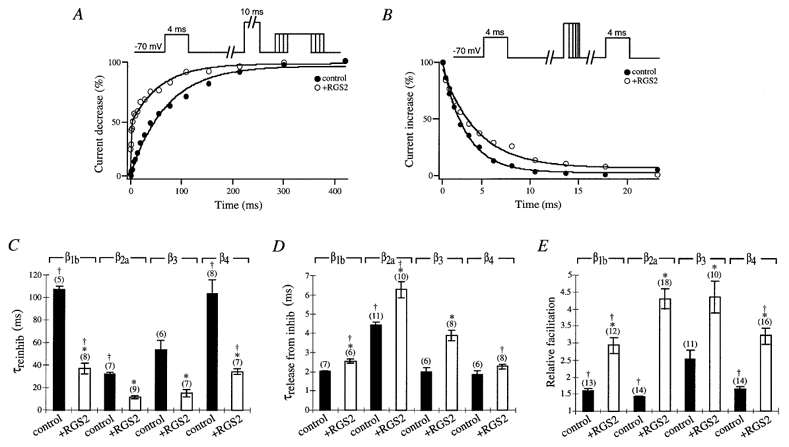
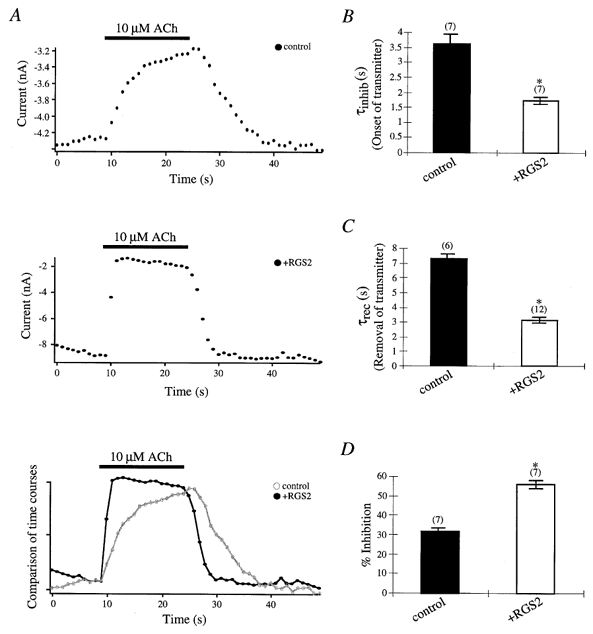
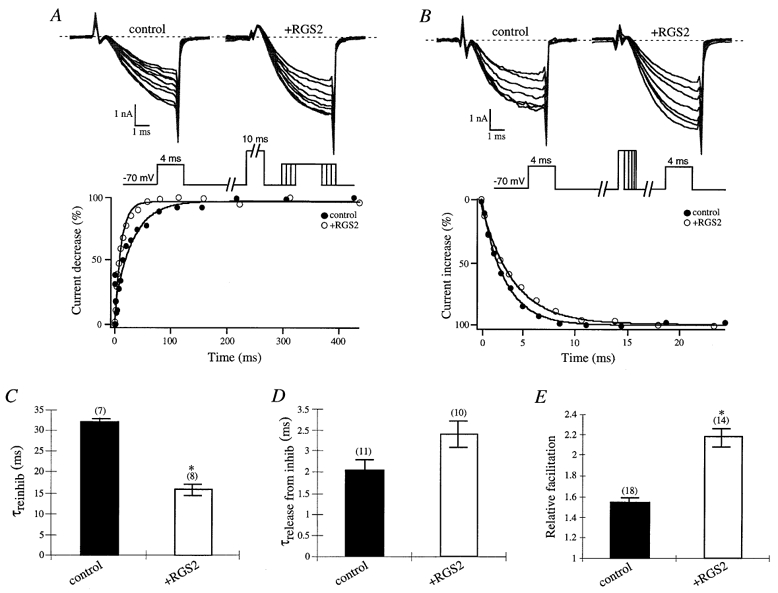
1. Fast synaptic transmission is triggered by the activation of presynaptic Ca2+ channels which can be inhibited by Gbetagamma subunits via G protein-coupled receptors (GPCR). Regulators of G protein signalling (RGS) proteins are GTPase-accelerating proteins (GAPs), which are responsible for >100-fold increases in the GTPase activity of G proteins and might be involved in the regulation of presynaptic Ca2+ channels. In this study we investigated the effects of RGS2 on G protein modulation of recombinant P/Q-type channels expressed in a human embryonic kidney (HEK293) cell line using whole-cell recordings. 2. RGS2 markedly accelerates transmitter-mediated inhibition and recovery from inhibition of Ba2+ currents (IBa) through P/Q-type channels heterologously expressed with the muscarinic acetylcholine receptor M2 (mAChR M2). 3. Both RGS2 and RGS4 modulate the prepulse facilitation properties of P/Q-type Ca2+ channels. G protein reinhibition is accelerated, while release from inhibition is slowed. These kinetics depend on the availability of G protein alpha and betagamma subunits which is altered by RGS proteins. 4. RGS proteins unmask the Ca2+ channel beta subunit modulation of Ca2+ channel G protein inhibition. In the presence of RGS2, P/Q-type channels containing the beta2a and beta3 subunits reveal significantly altered kinetics of G protein modulation and increased facilitation compared to Ca2+ channels coexpressed with the beta1b or beta4 subunit.


Figures

Figure 4
Figure 4
Effects of RGS2 on the G protein modulation of α1A/QQIEE mutant in the presence of GTPγS A, sample time courses of reinhibition are shown from cells expressing the α1A/QQIEE mutant in the presence (control; •) or absence (○) of RGS2 and in the presence of RGS2 plus Gαi1 subunit (+) with GTPγS in the intracellular solution. Currents were elicited by a 4 ms test pulse to +10 mV from a holding potential of −70 mV. After 1 s a 10 ms conditioning prepulse to +100 mV was applied to completely relieve G protein inhibition, the cell was repolarized to −70 mV for a period of 1–427 ms, and a second 4 ms test pulse to +10 mV was applied. Peak currents were normalized to the smallest peak current from the second test pulse, and reinhibition (%) was plotted versus the time interval at −70 mV between the prepulse and second test pulse. B, time constants for IBa reinhibition are shown from cells expressing the α1A/QQIER wild-type or α1A/QQIEE mutant with (□) or without (control; ▪) RGS2. Time courses of IBa reinhibition were fitted with a single exponential, and mean time constants (τreinhib) ± s.e.m. were plotted. In some cases the Gαi1 subunit was coexpressed as indicated. Numbers of cells tested are indicated in parentheses. * and † P < 0·05, Student’s t test. C, sample time courses of release from inhibition are shown from cells expressing the α1A/QQIEE mutant in the presence (control; •) or absence (○) of RGS2 and in the presence of RGS2 plus Gαi1 subunit (+) with GTPγS in the intracellular solution. Currents were elicited by a 4 ms test pulse to +10 mV from a holding potential of −70 mV. After 1 s a conditioning prepulse to +100 mV for a period of 1–23 ms was applied, the cell was repolarized to −70 mV for a period of 10 ms, and a second 4 ms test pulse to +10 mV was applied. Peak currents were normalized to the largest peak current from the second test pulse, and recovery from inhibition (%) was plotted versus the time interval at +100 mV. D, time constants for IBa release from inhibition are shown from cells expressing the α1A/QQIER wild-type or α1A/QQIEE mutant with (□) or without (control; ▪) RGS2. Time courses of IBa release from inhibition were fitted with a single exponential, and mean time constants (τrelease from inhib) ± s.e.m. were plotted. In some cases a Gαi1 subunit was coexpressed as indicated. Numbers of cells tested are indicated in parentheses. * and † P < 0·05, Student’s t test. E, relative means (± s.e.m.) of facilitation were determined from cells expressing the α1A/QQIER wild-type or α1A/QQIEE mutant with (□) or without (control; ▪) RGS2 as indicated. In some cases a G protein αi1 subunit was coexpressed as indicated. Currents were normalized to the largest peak current of the second test pulse versus the first test pulse from the traces in B and D. Numbers of cells tested are indicated in parentheses. * and † P < 0·05, Student’s t test. F, schematic diagram of the α1A subunit of the P/Q-type Ca2+ channel depicting the G protein-binding QXXER motif between loops I and II. The QXXER motif in the wild-type α1A subunit QQIER was mutated to QQIEE (Herlitze et al. 1997).
Figure 5
Figure 5
Effect of different Ca2+ channel β subunits on the G protein modulation of P/Q-type Ca2+ channels in the presence of RGS2 and Gβ1 subunit A, sample time courses of reinhibition are shown from cells expressing Gβ1 subunit and Ca2+ channel β3 subunit with (○) or without (control; •) RGS2. Currents were elicited by a 4 ms test pulse to +10 mV from a holding potential of −70 mV. After 1 s a 10 ms conditioning prepulse to +100 mV was applied to completely relieve G protein inhibition, the cell was repolarized to −70 mV for a period of 1–427 ms, and a second 4 ms test pulse to +10 mV was applied. Peak currents were normalized to the smallest peak current from the second test pulse, and reinhibition (%) was plotted versus the time interval at −70 mV between the prepulse and second test pulse. B, sample time courses of release from inhibition are shown from cells expressing Gβ1 subunit and Ca2+ channel β3 subunits with (○) or without (control; •) RGS2. Currents were elicited by a 4 ms test pulse to +10 mV from a holding potential of −70 mV. After 1 s a conditioning prepulse to +100 mV for a period of 1–23 ms was applied, the cell was repolarized to −70 mV for a period of 10 ms, and a second 4 ms test pulse to +10 mV was applied. Peak currents were normalized to the largest peak current from the second test pulse, and release from inhibition (%) was plotted versus the time interval at +100 mV. C, time constants for IBa reinhibition are shown from control (▪) and RGS2-expressing (□) cells with Gβ1 subunit and Ca2+ channel β1b, β2a, β3 or β4 subunits as indicated. Time courses of reinhibition were fitted with a single exponential, and mean time constants (τreinhib) ± s.e.m. were plotted. Numbers of cells tested are indicated in parentheses. * and † P < 0·05, Student’s t test. D, time constants for IBa release from inhibition are shown from control (▪) and RGS2-expressing (□) cells with Gβ1 subunit and Ca2+ channel β1b, β2a, β3 or β4 subunits as indicated. Time courses of IBa release from inhibition were fitted with a single exponential, and mean time constants (τrelease from inhib) ± s.e.m. were plotted. Numbers of cells tested are indicated in parentheses. * and † P < 0·05, Student’s t test. E, relative means (± s.e.m.) of facilitation were determined from control (▪) and RGS2-expressing (□) cells with Gβ1 subunit and Ca2+ channel β1b, β2a, β3 or β4 subunits as indicated. Currents were normalized to the largest peak current of the second test pulse versus the first test pulse from the traces in C and D. Numbers of cells tested are indicated in parentheses. * and † P < 0·05, Student’s t test.
Figure 1
Figure 1
Effects of RGS2 on M2 mAChR-mediated inhibition and recovery from inhibition of P/Q-type Ca2+ channels A, sample time courses of M2 mAChR-mediated IBa inhibition in a control (top trace) and RGS2- expressing (middle trace) cell are shown following application and removal of 10 μM ACh. Sample time courses (bottom trace) from the control cell (○, grey line) and RGS2-expressing cell (•) were compared following application and removal of 10 μM ACh. ACh was applied for 15 s and then washed out with external Ca2+ solution as described in the Methods. Currents were recorded with 10 mM Ba2+ as the current carrier through P/Q-type Ca2+ channels and were elicited by a 4 ms test pulse to +10 mV from a holding potential of −70 mV every second. B, time constants for M2 mAChR-mediated IBa inhibition are shown after ACh application in control (▪) and RGS2-expressing (□) cells. Time courses for IBa inhibition were fitted with a single exponential, and mean time constants (τinhib) ± s.e.m. were plotted. C, time constants for recovery from M2 mAChR-mediated P/Q-type IBa inhibition are shown after ACh removal in control (▪) and RGS2-expressing (□) cells. Time courses for recovery from IBa inhibition were fitted with a single exponential, and mean time constants (τrec) ± s.e.m. were plotted. D, percentage means (± s.e.m.) of inhibition of IBa by 10 μM ACh in control (▪) and RGS2-expressing (□) cells were plotted. Currents were normalized to the largest current inhibition after ACh application compared to currents before ACh application. In B-D, numbers of cells tested are indicated in parentheses; * P < 0·05, Student’s t test (see ‘Data analysis’ for explanation of significance tests in figures).
Figure 2
Figure 2
Effects of RGS2 on facilitation properties of P/Q-type Ca2+ channels during transmitter application A, time courses of IBa reinhibition during application of 10 μM ACh were determined by eliciting currents with a 4 ms test pulse to +10 mV from a holding potential of −70 mV. After 1 s a 10 ms conditioning prepulse to +100 mV was applied to relieve G protein inhibition, the cell was repolarized to −70 mV for a period of 1–427 ms, and a second 4 ms test pulse to +10 mV was applied. Sample IBa traces illustrating the reinhibition P/Q-type Ca2+ channels during 10 μM ACh application in a control and RGS-expressing cell are shown in the upper panel from every other time point. Peak currents were normalized to the smallest peak current from the second test pulse, and reinhibition (%) was plotted versus the time interval at −70 mV between the prepulse and second test pulse. The lower panel shows the time courses of current decrease from a control (▪) and RGS-expressing (□) cell during 10 μM ACh application. B, time courses of IBa release from inhibition during application of 10 μM ACh were determined by eliciting currents by a 4 ms test pulse to +10 mV from a holding potential of −70 mV. After 1 s a conditioning prepulse to +100 mV for a period of 1–23 ms was applied, the cell was repolarized to −70 mV for a period of 10 ms, and a second 4 ms test pulse to +10 mV was applied. Sample IBa traces illustrating the release from G protein inhibition during application of ACh in a control and RGS-expressing cell are shown in the upper panel from every other time point. Peak currents were normalized to the largest peak current from the second test pulse, and release from inhibition (%) was plotted versus the time interval at +100 mV. The lower panel shows the time courses of current increase from a control (▪) and RGS-expressing (□) cell during application of ACh. C, time constants for M2 mAChR-mediated IBa reinhibition are shown during ACh application in control (▪) and RGS2-expressing (□) cells. Time courses of IBa reinhibition during 10 μM ACh application in control (▪) and RGS-expressing (□) cells were fitted with a single exponential, and mean time constants (τreinhib) ± s.e.m. were plotted. Numbers of cells tested are indicated in parentheses. D, time constants for IBa release from M2 mAChR-mediated inhibition are shown during ACh application in control (▪) and RGS2-expressing (□) cells. Time courses of IBa release from M2 mAChR-mediated inhibition in control (▪) and RGS-expressing (□) cells were fitted with a single exponential, and mean time constants (τrelease from inhib) ± s.e.m. were plotted. Numbers of cells tested are indicated in parentheses. * P < 0·05, Student’s t test. E, relative means (± s.e.m.) of facilitation were plotted from control (▪) and RGS2-expressing (□) cells. Currents were normalized to the largest peak current of the second test pulse versus the first test pulse from the traces in C and D. Numbers of cells tested are indicated in parentheses. * P < 0·05, Student’s t test.
Figure 3
Figure 3
Effects of RGS2 and RGS4 on prepulse facilitation properties of P/Q-type Ca2+ channels during coexpression of Gβ1 subunit or activation of endogenous G proteins by GTPγS A, sample time courses of reinhibition are shown with Gβ1 subunit (•) and GTPγS in the intracellular solution with (+) or without (○) RGS2. Currents were elicited by a 4 ms test pulse to +10 mV from a holding potential of −70 mV. After 1 s a 10 ms conditioning prepulse to +100 mV was applied to completely relieve G protein inhibition, the cell was repolarized to −70 mV for a period of 1–427 ms, and a second 4 ms test pulse to +10 mV was applied. Peak currents were normalized to the smallest peak current from the second test pulse, and reinhibition (%) was plotted versus the time interval at −70 mV between the prepulse and second test pulse. B, sample time courses of release from inhibition are shown with Gβ1 subunit (•) and GTPγS in the intracellular solution with (+) or without (○) RGS2. Currents were elicited by a 4 ms test pulse to +10 mV from a holding potential of −70 mV. After 1 s a conditioning prepulse to +100 mV for a period of 1–23 ms was applied, the cell was repolarized to −70 mV for a period of 10 ms, and a second 4 ms test pulse to +10 mV was applied. Peak currents were normalized to the largest peak current from the second test pulse, and release from inhibition (%) was plotted versus the time interval at +100 mV. C, time constants for IBa reinhibition from control (▪), RGS2- (□) and RGS4-expressing (formula image
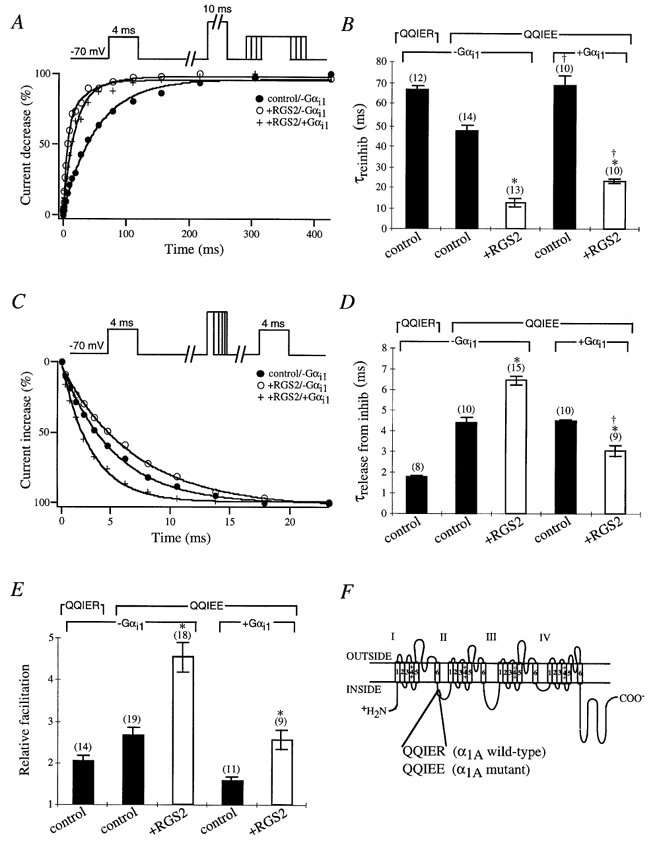
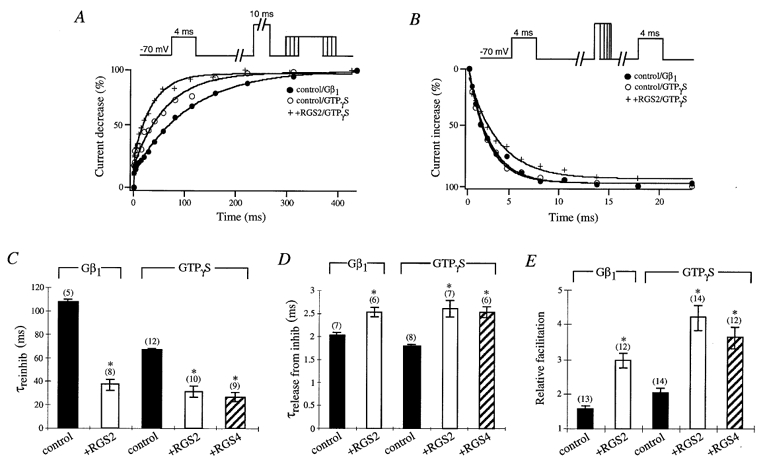
) cells are shown with Gβ1 subunit or GTPγS in the intracellular solution as indicated. Time courses of IBa reinhibition were fitted with a single exponential, and mean time constants (τreinhib) ± s.e.m. were plotted. Numbers of cells tested are indicated in parentheses. * P < 0·05, Student’s t test. D, time constants for IBa release from inhibition from control cells (▪), and RGS2- (□) and RGS4-expressing (formula image) cells, are shown with Gβ1 subunit or GTPγS in the intracellular solution as indicated. Time courses of IBa release from inhibition were fitted with a single exponential, and mean time constants (τrelease from inhib) ± s.e.m. were plotted. Numbers of cells tested are indicated in parentheses. * P < 0·05, Student’s t test. E, relative means (± s.e.m.) of facilitation were determined from control cells (▪), and RGS2- (□) and RGS4-expressing (formula image) cells, with Gβ1 subunit or GTPγS in the intracellular solution as indicated. Currents were normalized to the largest peak current of the second test pulse versus the first test pulse from the traces in C and D. Numbers of cells tested are indicated in parentheses. * P < 0·05, Student’s t test.

Similar articles

Cited by

References

    1. Berman DM, Gilman AG. Mammalian RGS proteins: barbarians at the gate. Journal of Biological Chemistry. 1998;273:1269–1272. - PubMed
    1. Birnbaumer L, Qin N, Olcese R, Tareilus E, Platano D, Costantin J, Stefani E. Structures and functions of calcium channel β subunits. Journal of Bioenergetics and Biomembranes. 1998;30:357–375. - PubMed
    1. Boland LM, Bean BP. Modulation of N-type calcium channels in bullfrog sympathetic neurons by luteinizing hormone-releasing hormone: kinetics and voltage dependence. Journal of Neuroscience. 1993;13:516–533. - PMC - PubMed
    1. Bourinet E, Soong TW, Stea A, Snutch TP. Determinants of the G protein-dependent opioid modulation of neuronal calcium channels. Proceedings of the National Academy of Sciences of the USA. 1996;93:1486–1491. - PMC - PubMed
    1. Bünemann M, Hosey MM. Regulators of G protein signalling (RGS) proteins constitutively activate Gβγ-gated potassium channels. Journal of Biological Chemistry. 1998;273:31186–31190. - PubMed

Publication types

MeSH terms

LinkOut - more resources