. 2000 Oct 1;528 Pt 1(Pt 1):131-50.
doi: 10.1111/j.1469-7793.2000.t01-1-00131.x.

Relationship between the time course of the afterhyperpolarization and discharge variability in cat spinal motoneurones

Affiliations

Relationship between the time course of the afterhyperpolarization and discharge variability in cat spinal motoneurones

R K Powers et al. J Physiol. .

Abstract

1. We elicited repetitive discharges in cat spinal motoneurones by injecting noisy current waveforms through a microelectrode to study the relationship between the time course of the motoneurone's afterhyperpolarization (AHP) and the variability in its spike discharge. Interspike interval histograms were used to estimate the interval death rate, which is a measure of the instantaneous probability of spike occurrence as a function of the time since the preceding spike. It had been previously proposed that the death rate can be used to estimate the AHP trajectory. We tested the accuracy of this estimate by comparing the AHP trajectory predicted from discharge statistics to the measured AHP trajectory of the motoneurone. 2. The discharge statistics of noise-driven cat motoneurones shared a number of features with those previously reported for voluntarily activated human motoneurones. At low discharge rates, the interspike interval histograms were often positively skewed with an exponential tail. The standard deviation of the interspike intervals increased with the mean interval, and the plots of standard deviation versus the mean interspike interval generally showed an upward bend, the onset of which was related to the motoneurone's AHP duration. 3. The AHP trajectories predicted from the interval death rates were generally smaller in amplitude (i.e. less hyperpolarized) than the measured AHP trajectories. This discrepancy may result from the fact that spike threshold varies during the interspike interval, so that the distance to threshold at a given time depends upon both the membrane trajectory and the spike threshold trajectory. Nonetheless, since the interval death rate is likely to reflect the instantaneous distance to threshold during the interspike interval, it provides a functionally relevant measure of fluctuations in motoneurone excitability during repetitive discharge.


Figures

Figure 1
Figure 1
Measurement of the intrinsic properties of motoneurones and the characteristics of their noise-driven discharge A, response of a motoneurone (upper trace) to an injected current waveform (lower trace) composed of: (1) a series of hyperpolarizing pulses, (2) a variable delay, (3) a long current step just subthreshold for repetitive discharge, (4) a 26.2 s zero mean random noise component, (5) another delay and (6) a second set of hyperpolarizing current pulses. Before and after the noise component a series of eight single spikes were evoked by 1 ms suprathreshold current pulses in order to measure the average postspike AHP (see C). B, average voltage decay following the offset of the hyperpolarizing current pulses (dots), with the best double exponential fit to the response (continuous line). The background membrane potential was subtracted from the response and the result multiplied by −1. C, average AHP following spikes evoked at a membrane potential just subthreshold for repetitive discharge. (The mean background membrane potential has been subtracted from the response.) AHPs were characterized in terms of their peak amplitude, total duration (time from the spike onset to the point at which the membrane potential returned to within 2 standard deviations of the mean background membrane potential) and duration at half-amplitude. D, values of consecutive ISIs during the noise-driven discharge shown in A. The dots correspond to individual ISIs, whereas the continuous line represents the mean of 10 consecutive intervals. This running mean was used to subdivide the ISI record into portions in which the running mean was between 70 and 90 ms (S1; lower and middle horizontal dashed lines) and 90 and 110 ms (S2; middle and upper horizontal dashed lines).
Figure 4
Figure 4
ISI histograms and interval death rates A, ISI histograms for two different motoneurones firing at about the same mean rate. The thick line represents the ISI histogram from a motoneurone with a short AHP, whereas the thin line is the ISI histogram from a motoneurone with a long AHP. The curved dashed line is an exponential fit to the tail of the ISI histogram for the short AHP motoneurone. B, interval death rates for the ISI histograms in A. The interval death rate for the motoneurone with the long AHP (○) is closely approximated by the interval death rate expected for a normally distributed process with the same mean and standard deviation (curved dotted line). In contrast, the interval death rate for the short AHP motoneurone (•) clearly deviates from the normal prediction (curved continuous line). Instead, the function reaches a constant level (dashed horizontal line) corresponding to the rate of exponential decay of the tail of the ISI histogram. C, ISI histograms for the same motoneurone firing at two different mean rates (11.4 impulses s−1, thin line; 13.8 impulses s−1, thick line). Both histograms decay exponentially at long intervals. D, corresponding interval death rates (○, low firing rate; •, high firing rate). See text for further details.
Figure 2
Figure 2
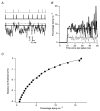
Determination of the relation between distance to threshold and interval death rate A, voltage noise (bottom trace) is used as the input to a threshold detector with a 10 ms refractory period. The top trace illustrates the output of the threshold detector when the threshold was set to a value that was 1.5 mV above the mean noise level (dashed horizontal line), whereas the second trace from the top is the output for a threshold level of 1 mV (continuous horizontal line). B, interval death rates calculated from the spike output of the threshold detector for a threshold level of 1 mV (upper trace) and 1.5 mV (lower trace). The mean death rates are indicated by the horizontal lines. C, relation between the mean distance to threshold and the mean interval death rate (•). The continuous line is the best double exponential fit to the points.
Figure 3
Figure 3
Relations between the standard deviation and the mean ISI A, standard deviation versus mean ISI for interval sets obtained from a series of responses to 26.2 s injected current noise waveforms; •, data from motoneurones with short AHPs (half-duration < 50 ms); ○, data from motoneurones with long AHPs (half-duration > 50 ms). B, same as A, except that only interval data obtained from responses to filtered current noise are shown. C, standard deviation versus mean ISI for two individual motoneurones, obtained from a series of responses to 10 s of filtered current noise with different mean current levels. The AHP durations of the two motoneurones are indicated by the arrows on the time axis (data from one motoneurone indicated by filled circles and arrowhead, the other by open circles and arrowhead).
Figure 5
Figure 5
Relation between the degree of skew of the ISI histograms and the difference between the mean ISI and the AHP duration The data represent ISI histograms that did (○) or did not (•) deviate significantly from a normal distribution.
Figure 6
Figure 6
Characteristics of voltage noise and its effects on the relation between distance to threshold and interval death rate A, distance to threshold versus interval death rate relations for all of the motoneurones. Thin lines represent the predicted relations for unfiltered current noise, whereas thick lines correspond to the relations for filtered noise. Dashed line is the ‘4 ms transform’ used by Matthews (1996). B, relations for a single motoneurone subjected to both filtered (thick line) and unfiltered (thin line) current noise. C, autocorrelograms of voltage noise produced in the motoneurone of B by filtered (thick line) and unfiltered (thin line) current noise. The dotted line is the autocorrelogram of the background synaptic noise recorded in the same cell. The dashed line represents the voltage noise produced by an RC filter with a time constant of 5 ms in response to a white noise input. D, power spectra of the different voltage noise waveforms. (Different line types have the same meaning as in C.)
Figure 7
Figure 7
Predicted and measured AHP trajectories for two different motoneurones firing at about the same mean rate A and B, ISI histograms (thin lines) and interval death rates (•) for the two motoneurones. C and D, average AHPs for the two motoneurones compiled from a series of spikes elicited before (thin traces) and after (thick traces) each application of the noise waveform. E and F, predicted (○) and measured (•) AHP trajectories. See text for further details.
Figure 8
Figure 8
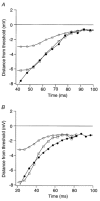
Predicted and measured AHP trajectories for two different motoneurones •, measured AHP trajectories; ○, trajectories estimated from the interval death rates; □, scaled versions of the estimated trajectories, with the scaling factor chosen to minimize the squared error between the scaled trajectories and the measured trajectories. A, example of a case in which the scaled trajectory provides a close fit to the measured trajectory. B, a case in which the scaled trajectory does not match the measured trajectory.
Figure 9
Figure 9
Deduction of the AHP from the model's interval histograms A, interval histograms, approximating to probability density functions, for three different firing rates generated by varying the model's mean excitatory conductance, while keeping the inhibitory, noise and AHP conductances constant. Each histogram is based on simulated firing for some 30 min yielding 24 000–54 000 intervals. B, the interval histograms transformed into plots of interval death rate versus time. These plots terminate after inclusion of 98 % of the intervals, as they then became excessively variable. C, the points give the estimated AHPs obtained by applying the ‘4 ms transform’ (Matthews, 1996) to the death rate plots. The continuous lines show the actual AHPs for the same mean input, determined by measuring the membrane voltage after removing the noise and eliminating spiking. The AHPs have been plotted in noise units (1 noise unit = 0.67 mV), corresponding to the standard deviation of the voltage noise. (The model parameter values were as follows: leak conductance, 0.5 μS, equilibrium potential = 0 mV; fixed spike threshold, +15 mV; excitatory conductances, 0.385, 0.400 and 0.430 μS, ±0.04 μS noise (s.d.), equilibrium potential = +70 mV; inhibitory conductance, 0.5 ± 0.05 μS, equilibrium potential = −15 mV; AHP initial conductance 0.4 μS decaying with a time constant of 30 ms, equilibrium potential = −15 mV; membrane capacitance, 5.5–5.7 nF, fine-tuned for each to bring the membrane time constant to 4 ms at final equilibrium.) No residual AHP conductance was carried forward to the subsequent interval. (See Matthews, 1999, for further details).
Figure 10
Figure 10
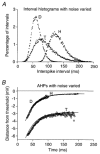
Estimation of the AHP using different amounts of noise The interval histograms (A) and the AHPs (B) on halving (H), doubling (D), or tripling the noise (T). The mean synaptic excitation for plots H and D was the same as that for the middle histogram of Fig. 9 (10.9 Hz). Doubling the noise increased the firing rate to 16.8 Hz and halving the noise reduced it to 7.5 Hz, but the transform still gave a good estimate (circles, dots) of the invariant directly measured AHP (continuous line); all values are plotted in millivolts. The two noise levels provide estimates of different segments of the AHP, with only a slight overlap. When the noise was tripled (T) the mean synaptic drive was reduced to below the firing level for the original noise, but with the extra noise, firing was restored at 11.0 Hz. The resulting interval histogram (T) is much wider than the central histogram in Fig. 9A for virtually the same firing rate. The initial part of the AHP estimate (○) in B now shows a small but systematic deviation from the direct AHP (continuous line), presumably because of the non-linearities associated with a greater absolute deviation from threshold. (The excitatory conductance was reduced from 0.4 μS for H and D to 0.34 μS for T. The ‘standard’ noise of 0.67 mV of Fig. 1 was altered by changing the standard excitatory and inhibitory noise conductances by the same proportion. All other parameter values as in Fig. 1, except for a slightly smaller capacitance for T.)
Figure 11
Figure 11
Responses with injected current Agreement of estimated and measured AHPs in a reduced model, in which the synaptic conductances have been replaced by an injected current with noise. The AHP and leak conductances were retained, as for Fig. 9, and the membrane's time constant held at 4 ms by adjusting its capacitance. The excitation was provided by currents of 6.5, 7.1 and 8.4 nA each with ±2 nA current noise which produced 1.39 mV voltage noise; the membrane capacitance was 2 nF.
Figure 12
Figure 12
Insignificant action of potential complicating factors AHPs from a full conductance model illustrating two minor complicating factors. The top line (slightly wiggly) shows the AHP estimated using the death rate transform. It now deviates slightly from the measured AHP, given by the smooth line just below, because the membrane time constant has been increased to 8 ms. This enhances the weak excitatory effect of the finite slope of the AHP. This effect can be readily allowed for when using the transform to estimate the AHP (slope correction, see text). The corrected estimate is given by the points, which lie close to the measured AHP. The bottom line (slightly irregular) shows the small but definite augmentation of the AHP (slope-corrected estimate) produced by allowing the residual AHP conductance that remains at the time of spike initiation to be carried over into the next ISI. Normally, the total AHP conductance was reset to a constant value. The excitatory conductance was 0.41 μS and the noise conductances were twice those of Fig. 1, giving a membrane voltage noise of 0.94 mV. The slope correction factor was 2.5 noise units for a slope of 1 noise unit ms−1.

Similar articles

Cited by

References

    1. Baldissera F, Gustafsson B. Afterhyperpolarization time course in lumbar motoneurones of the cat. Acta Physiologica Scandinavica. 1974;91:512–527. - PubMed
    1. Berry MJ, II, Meister M. Refractoriness and neural precision. Journal of Neuroscience. 1998;18:2200–2211. - PMC - PubMed
    1. Binder MD, Heckman CJ, Powers RK. The physiological control of motoneuron activity. In: Rowell LB, Shepherd JT, editors. Handbook of Physiology, section 12, Exercise: Regulation and Integration of Multiple Systems. New York: Oxford University Press; 1996. pp. 3–53.
    1. Binder MD, Robinson FR, Powers RK. Distribution of effective synaptic currents in cat triceps surae motoneurons. VI. Contralateral pyramidal tract. Journal of Neurophysiology. 1998;80:5241–5248. - PubMed
    1. Calvin WH. Three modes of repetitive firing and the role of threshold time course between spikes. Brain Research. 1974;69:341–346. - PubMed

Publication types

LinkOut - more resources