

Possible involvement of myofibroblasts in cellular recovery of uranyl acetate-induced acute renal failure in rats
- PMID: 11021836
- PMCID: PMC1850176
- DOI: 10.1016/S0002-9440(10)64647-0
Possible involvement of myofibroblasts in cellular recovery of uranyl acetate-induced acute renal failure in rats
Abstract
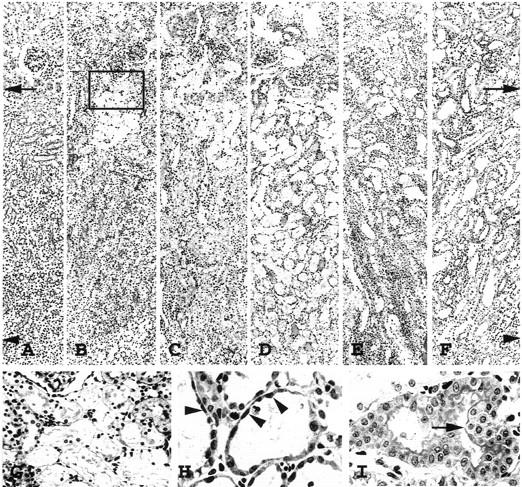
Cellular recovery in acute renal failure is a form of wound healing. Fibroblast-like cells or myofibroblasts are involved in wound healing. We examined the serial changes in tubular damage and origin and kinetics of regenerating cells in uranyl acetate-induced acute renal failure, with a special emphasis on interstitial myofibroblasts. Acute renal failure was induced in rats by intravenous injection of uranyl acetate (5 mg/kg). All rats received bromodeoxyuridine intraperitoneally 1 hour before sacrifice. Serial changes in the distribution of tubular necrosis and bromodeoxyuridine-incorporated or vimentin-positive regenerating cells, and their spatial and temporal relation to alpha-smooth muscle actin-positive myofibroblasts as well as ED 1-positive monocytes/macrophages were examined. Necrotic tubules initially appeared around the corticomedullary junction after uranyl acetate injection, then spread both downstream and upstream of proximal tubules. Peritubular alpha-smooth muscle actin-positive myofibroblasts appeared and extended along the denuded tubular basement membrane, establishing network formation throughout the cortex and the outer stripe of outer medulla at days 4 to 5. Tubular regeneration originated in nonlethally injured cells in the distal end of S3 segments, which was confirmed by lectin and immunohistochemical staining using markers for tubular segment. Subsequently, upstream proliferation was noted along the tubular basement membrane firmly attached by myofibroblasts. During cellular recovery, no entry of myofibroblasts into the tubular lumen across the tubular basement membrane was noted and only a few myofibroblasts showed bromodeoxyuridine positivity. The fractional area of alpha-smooth muscle actin-positive interstitium reached a peak level at day 7 in the cortex and outer stripe of outer medulla, then gradually disappeared by day 15 and remained only around dilated tubules and in the expanded interstitium at day 21. ED 1-positive monocytes/macrophages were transiently infiltrated mainly into the region of injury. They did not show specific association with initially necrotic tubules, but some of them located in close proximity to regenerating tubules. Nonlethally injured cells at the distal end of proximal tubules are likely to be the main source of tubular regeneration, and the transient appearance of interstitial myofibroblasts attached to the tubular basement membrane immediately after tubular necrosis might play a role in promoting cellular recovery in possible association with monocytes/macrophages in uranyl acetate-induced acute renal failure.
Figures


Similar articles
-
Mycophenolate mofetil inhibits regenerative repair in uranyl acetate-induced acute renal failure by reduced interstitial cellular response.Am J Pathol. 2002 Jul;161(1):217-27. doi: 10.1016/S0002-9440(10)64173-9. Am J Pathol. 2002. PMID: 12107106 Free PMC article.
-
Relation of distal nephron changes to proximal tubular damage in uranyl acetate-induced acute renal failure in rats.Am J Nephrol. 2002 Sep-Dec;22(5-6):405-16. doi: 10.1159/000065265. Am J Nephrol. 2002. PMID: 12381937
-
Kinetics and characterization of initially regenerating proximal tubules in S3 segment in response to various degrees of acute tubular injury.Nephrol Dial Transplant. 2006 Jan;21(1):41-50. doi: 10.1093/ndt/gfi035. Epub 2005 Aug 2. Nephrol Dial Transplant. 2006. PMID: 16077144
-
Renal stem cells in recovery from acute kidney injury.Minerva Urol Nefrol. 2006 Dec;58(4):329-37. Minerva Urol Nefrol. 2006. PMID: 17268398 Review.
-
Fibroblasts and myofibroblasts in renal fibrosis.Int J Exp Pathol. 2011 Jun;92(3):158-67. doi: 10.1111/j.1365-2613.2011.00764.x. Epub 2011 Feb 28. Int J Exp Pathol. 2011. PMID: 21355940 Free PMC article. Review.
Cited by
-
Wnt/β-catenin signaling in kidney injury and repair: a double-edged sword.Lab Invest. 2016 Feb;96(2):156-67. doi: 10.1038/labinvest.2015.153. Epub 2015 Dec 21. Lab Invest. 2016. PMID: 26692289 Free PMC article. Review.
-
Temporary changes in macrophages and MHC class-II molecule-expressing cells in the tubulointerstitium in response to uranyl acetate-induced acute renal failure in rats.Virchows Arch. 2003 Aug;443(2):206-16. doi: 10.1007/s00428-003-0839-6. Epub 2003 Jun 13. Virchows Arch. 2003. PMID: 12811555
-
Mycophenolate mofetil inhibits regenerative repair in uranyl acetate-induced acute renal failure by reduced interstitial cellular response.Am J Pathol. 2002 Jul;161(1):217-27. doi: 10.1016/S0002-9440(10)64173-9. Am J Pathol. 2002. PMID: 12107106 Free PMC article.
-
Hyperosmotic stress induces epithelial-mesenchymal transition through rearrangements of focal adhesions in tubular epithelial cells.PLoS One. 2021 Dec 21;16(12):e0261345. doi: 10.1371/journal.pone.0261345. eCollection 2021. PLoS One. 2021. PMID: 34932568 Free PMC article.
-
Different modes of renal proximal tubule regeneration in health and disease.World J Nephrol. 2012 Aug 6;1(4):92-9. doi: 10.5527/wjn.v1.i4.92. World J Nephrol. 2012. PMID: 24175246 Free PMC article.
References
-
- Alpers CE, Hudkins KL, Floege J, Johnson RJ: Human renal cortical interstitial cells with some features of smooth muscle cells participate in tubulointerstitial and crescentic glomerular injury. J Am Soc Nephrol 1994, 5:201-209 - PubMed
-
- Hewitson TD, Becker GJ: Interstitial myofibroblasts in IgA glomerulonephritis. Am J Nephrol 1995, 15:111-117 - PubMed
-
- Zhang G, Moorhead PJ, el Nahas AM: Myofibroblasts and the progression of experimental glomerulonephritis. Exp Nephrol 1995, 3:308-318 - PubMed
-
- Hay ED, Zuk A: Transformations between epithelium and mesenchyme: normal, pathological, and experimentally induced. Am J Kidney Dis 1995, 26:678-690 - PubMed
-
- Toback FG: Regeneration after acute tubular necrosis. Kidney Int 1992, 41:226-246 - PubMed
MeSH terms
Substances
LinkOut - more resources
Full Text Sources
