. 2000 Nov;74(21):9878-88.
doi: 10.1128/jvi.74.21.9878-9888.2000.

Adeno-associated virus RNAs appear in a temporal order and their splicing is stimulated during coinfection with adenovirus

Affiliations

Adeno-associated virus RNAs appear in a temporal order and their splicing is stimulated during coinfection with adenovirus

M B Mouw et al. J Virol. 2000 Nov.

Abstract

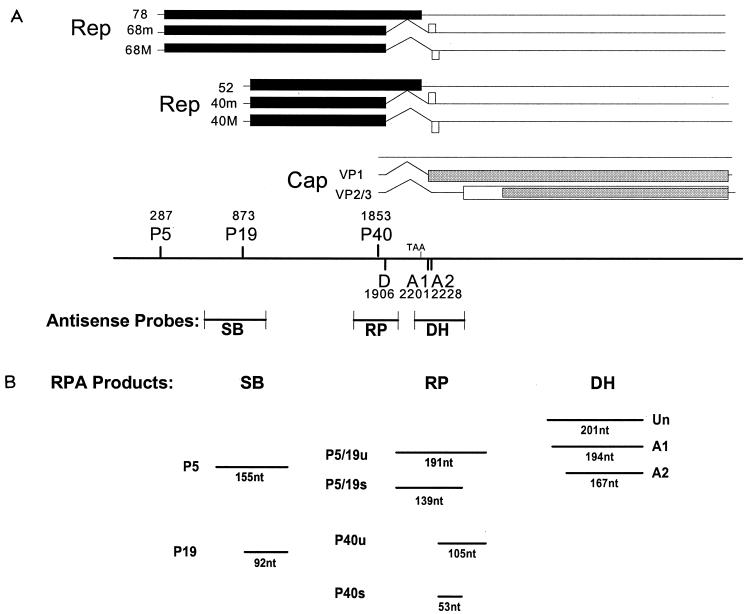
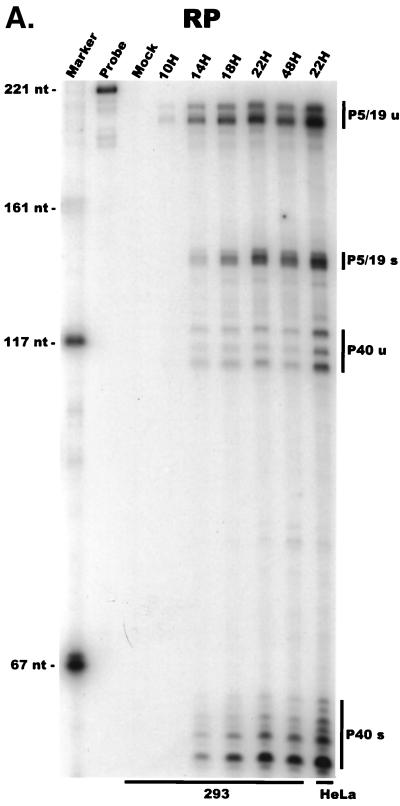
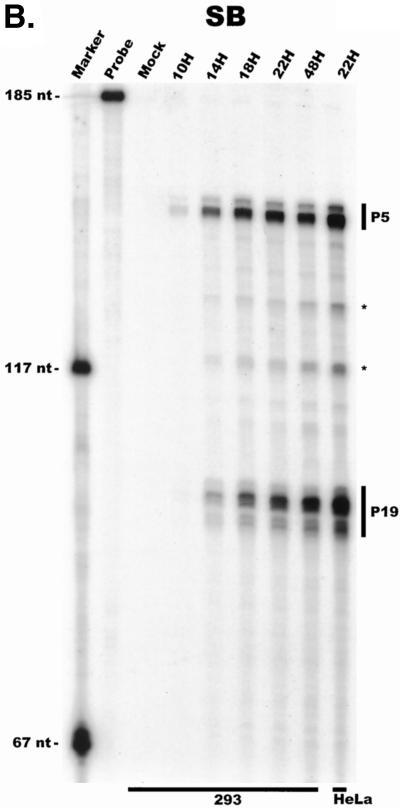
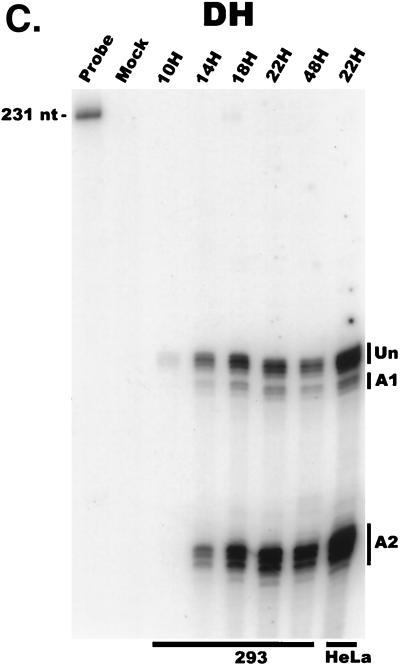
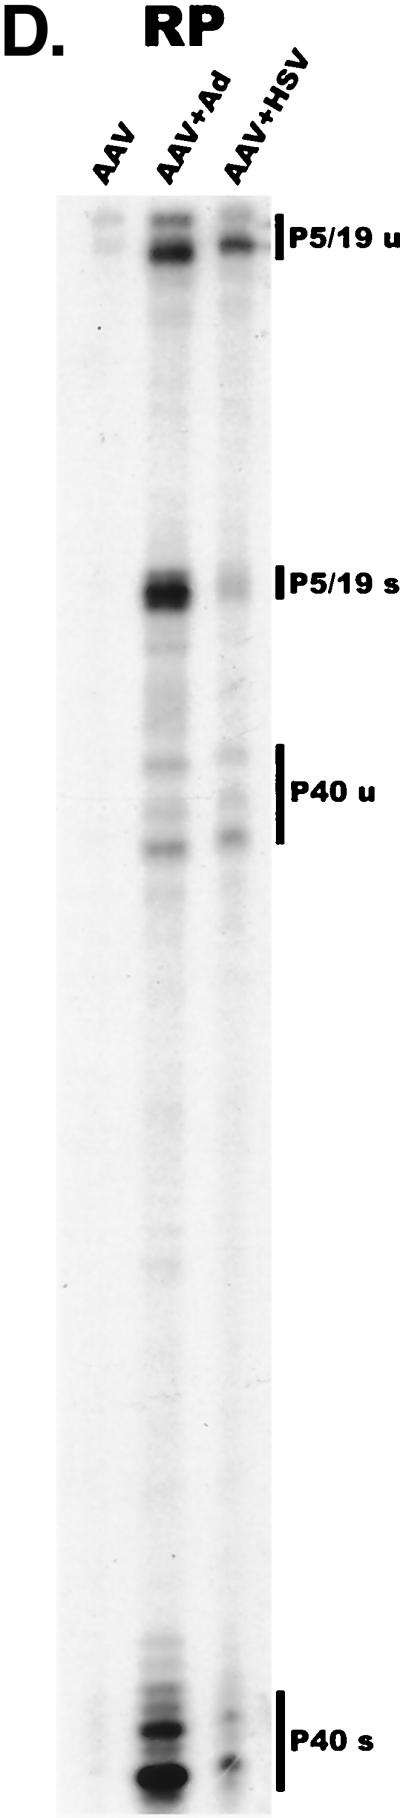
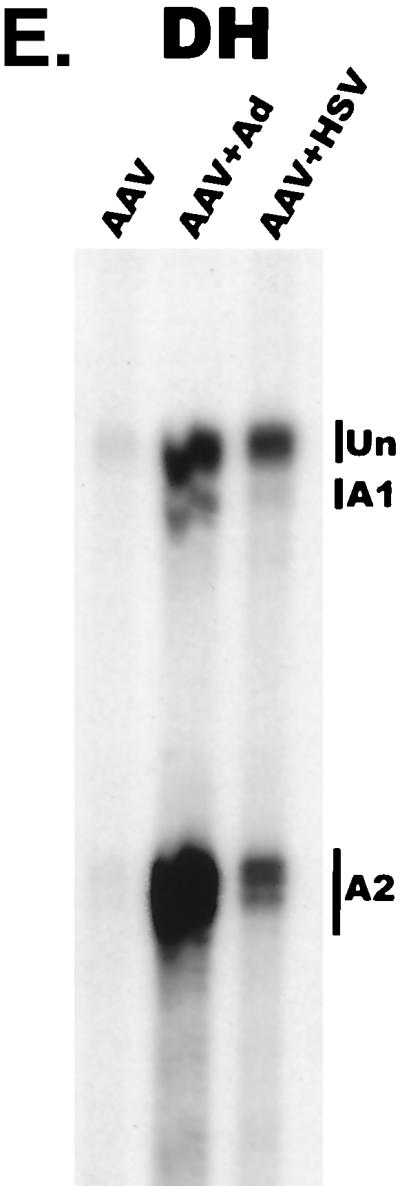
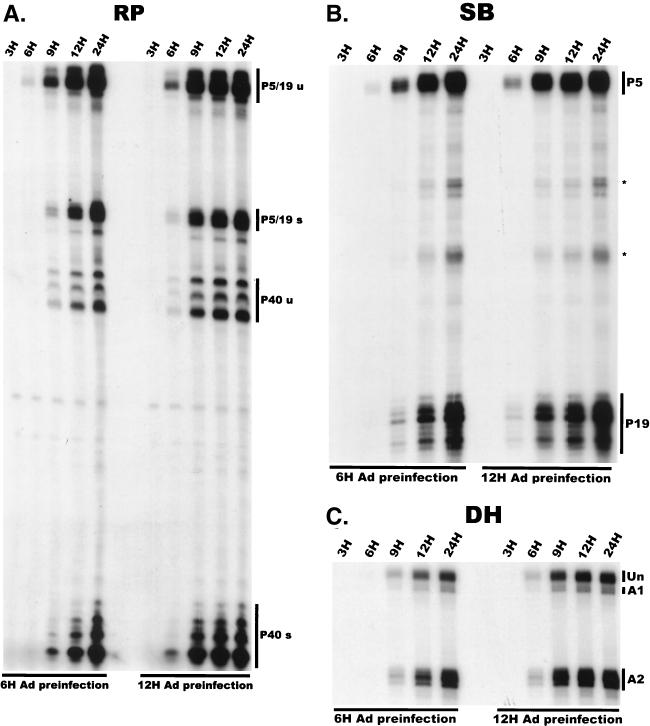
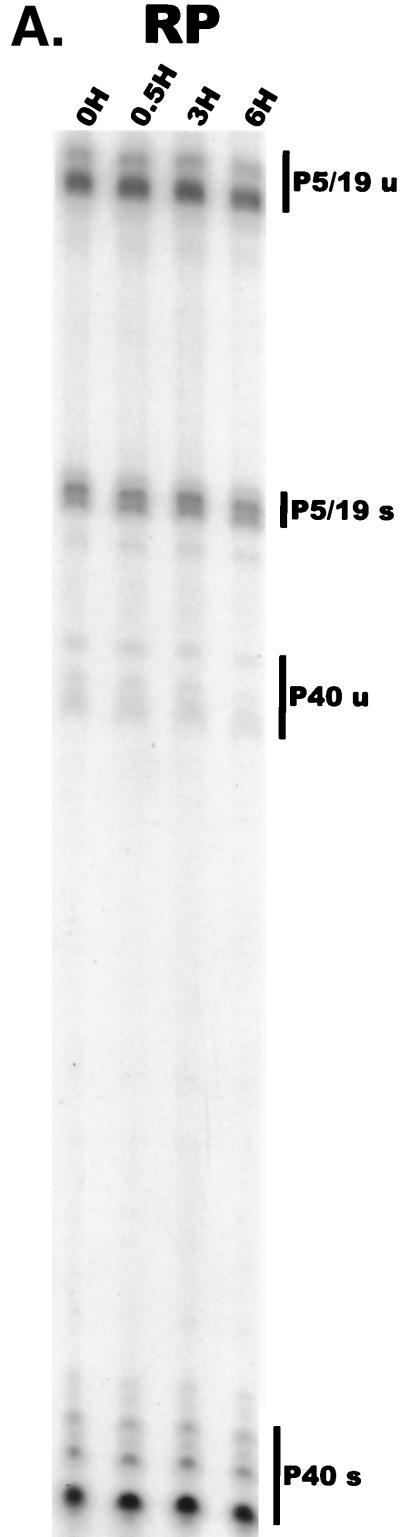
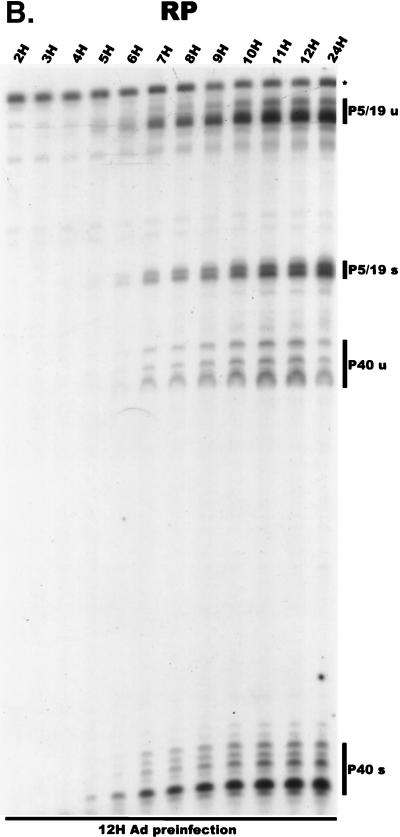
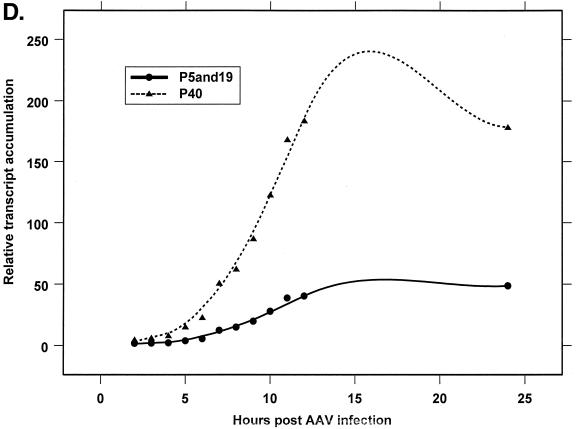
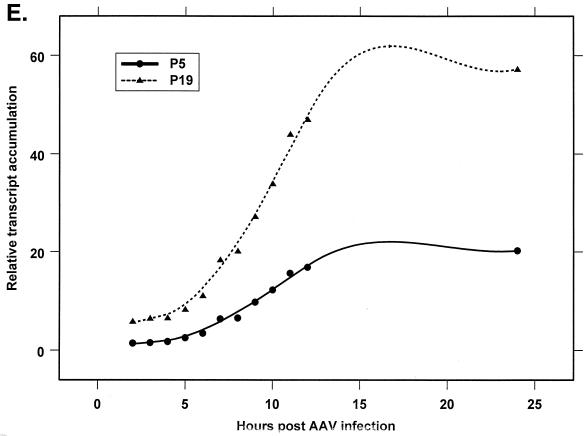
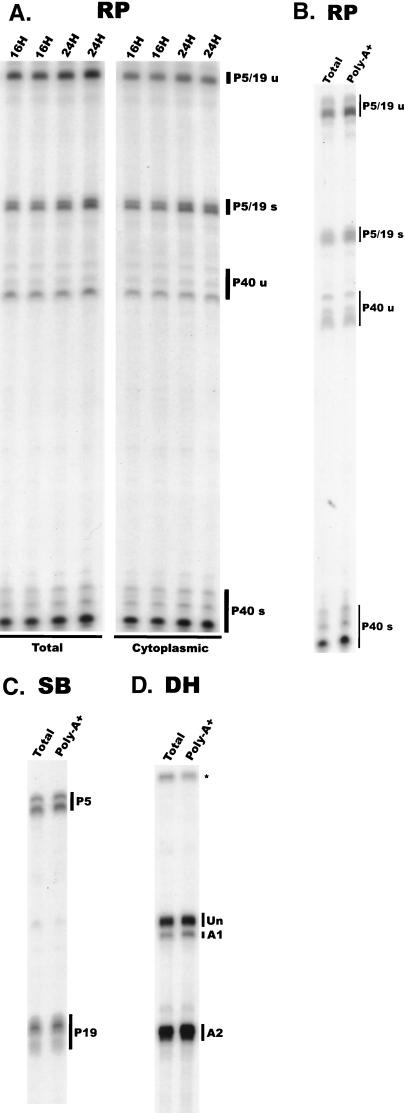
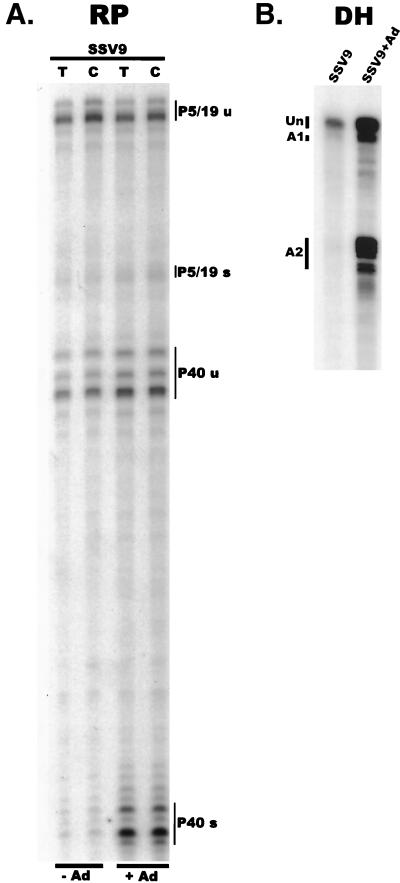
We have used a quantitative RNase protection assay to characterize the relative accumulation and abundance of individual adeno-associated virus type 2 (AAV) RNAs throughout the course of AAV-adenovirus coinfections and preinfections. We have demonstrated that there is a previously unrecognized temporal order to the appearance of AAV RNAs. First, unspliced P5-generated transcripts, which encode Rep78, were detectable prior to the significant accumulation of other AAV RNAs. Ultimately, as previously demonstrated, P19-generated products accumulated to levels greater than those generated from P5, and P40-generated transcripts predominated in the total RNA pool. Second, the percentage of each class of AAV RNA that was spliced increased during infection, and the degree of this increase was different for the P5/P19 products than for those generated by P40. At late times postcoinfection, approximately 90% of P40 products, but only approximately 50% of RNAs generated by P5 and P19, were seen to be spliced; thus, the AAV intron was removed to different final levels from these different RNA species. We have shown that each of the AAV RNAs is quite stable; the majority of each RNA species persisted 6 h after treatment with actinomycin D. Quantification of the accumulation of individual AAV RNAs, over intervals during which degradation was negligible, allowed us to infer that at late times during infection the relative strength of P5, P19, and P40 was approximately 1:3:18, respectively, consistent with the steady-state accumulated levels of the RNAs generated by each promoter. All AAV RNAs exited to the cytoplasm with similar efficiencies in the presence or absence of adenovirus; however, adenovirus coinfection appeared to stimulate total splicing of AAV RNAs and the relative use of the downstream intron acceptor. Our results confirm and extend previous observations concerning the appearance and processing of AAV-generated RNAs.


Figures

FIG. 1
FIG. 1
(A) Genetic map of AAV. Transcripts and protein-encoding regions for the three AAV promoters are shown. Promoters and intron donor and acceptor sites are mapped with their AAV nucleotide designations. Antisense AAV RNA probes used in our assays are positioned relative to the AAV genome and are described in Materials and Methods. (B) Schematic representation of probe fragments protected by AAV transcripts. Individual fragments are diagramed in their approximate relative positions when separated on a 6% denaturing polyacrylamide gel. U, unspliced; s, sliced.
FIG. 2
FIG. 2
AAV RNA accumulates in a temporal manner during helper virus coinfection. (A) P5/19 unspliced transcripts are detectable prior to significant accumulation of other AAV RNAs. The RP probe was used to protect 10 μg of total RNA isolated at indicated times from infected 293 or HeLa cells (indicated at the bottom). Cells were coinfected with AAV (MOI = 10) and Ad (MOI = 2 to 5) at time zero. AAV-specific products are indicated on the right (u, unspliced; s, spliced). Marker and Probe lanes display reference size standards which are indicated on the left. Lanes labeled Mock display protections of uninfected 293 cell RNA. Multiple bands seen for the probes spanning P19 and P40 likely reflect the use of multiple initiation sites within these regions; additional bands may include incomplete RNase digestion of probe-RNA complexes. (B) P5-generated transcripts are detectable before significant accumulation of those generated by P19. The SB probe was used to protect the same RNA and exactly as described for panel A. At 10 h postcoinfection, P5 transcripts predominate. Later in infection (18 to 221 h), P19 products accumulate to approximately two- to threefold-greater levels than P5 products. Asterisks indicate likely breakdown products of P5 protected fragments and were excluded from quantification. (C) Levels of spliced versus unspliced RNAs increase over the course of infection. The DH probe was used to protect the same RNA samples as above exactly as described for panel A, except that the nt 161 marker had just run off the bottom of this gel. (D) Coinfection of AAV with HSV yields AAV steady-state RNA ratios similar to those found after AAV-Ad coinfection. The RP probe was used to protect 10 μg of total RNA isolated from 293 cells approximately 24 h after infection with AAV (MOI = 10) alone, coinfection with Ad (MOI = 2 to 10), or coinfection with HSV (MOI = 2 to 10). In this experiment, likely due to infection conditions, the level of AAV expression in response to HSV coinfection was atypically low. The ratio of the various RNA species, however, remains the same. (E) HSV stimulates AAV splice acceptor usage similarly to Ad. The DH probe was used to protect the same RNA samples as used for the experiments shown in panel D.
FIG. 2
FIG. 2
AAV RNA accumulates in a temporal manner during helper virus coinfection. (A) P5/19 unspliced transcripts are detectable prior to significant accumulation of other AAV RNAs. The RP probe was used to protect 10 μg of total RNA isolated at indicated times from infected 293 or HeLa cells (indicated at the bottom). Cells were coinfected with AAV (MOI = 10) and Ad (MOI = 2 to 5) at time zero. AAV-specific products are indicated on the right (u, unspliced; s, spliced). Marker and Probe lanes display reference size standards which are indicated on the left. Lanes labeled Mock display protections of uninfected 293 cell RNA. Multiple bands seen for the probes spanning P19 and P40 likely reflect the use of multiple initiation sites within these regions; additional bands may include incomplete RNase digestion of probe-RNA complexes. (B) P5-generated transcripts are detectable before significant accumulation of those generated by P19. The SB probe was used to protect the same RNA and exactly as described for panel A. At 10 h postcoinfection, P5 transcripts predominate. Later in infection (18 to 221 h), P19 products accumulate to approximately two- to threefold-greater levels than P5 products. Asterisks indicate likely breakdown products of P5 protected fragments and were excluded from quantification. (C) Levels of spliced versus unspliced RNAs increase over the course of infection. The DH probe was used to protect the same RNA samples as above exactly as described for panel A, except that the nt 161 marker had just run off the bottom of this gel. (D) Coinfection of AAV with HSV yields AAV steady-state RNA ratios similar to those found after AAV-Ad coinfection. The RP probe was used to protect 10 μg of total RNA isolated from 293 cells approximately 24 h after infection with AAV (MOI = 10) alone, coinfection with Ad (MOI = 2 to 10), or coinfection with HSV (MOI = 2 to 10). In this experiment, likely due to infection conditions, the level of AAV expression in response to HSV coinfection was atypically low. The ratio of the various RNA species, however, remains the same. (E) HSV stimulates AAV splice acceptor usage similarly to Ad. The DH probe was used to protect the same RNA samples as used for the experiments shown in panel D.
FIG. 3
FIG. 3
AAV RNA accumulation following helper virus preinfection. (A) P5/19 products accumulate prior to other AAV RNAs in 293 cells preinfected with Ad. The RP probe was used to protect 10 μg of total RNA exactly as for Fig. 2 except that 293 cells were preinfected with Ad (MOI = 2 to 5) for 6 or 12 h (indicated at the bottom). Total RNA was isolated at the times indicated after AAV infection at time zero. u, unspliced; s, spliced. (B) P5 products accumulate prior to P19 products in 293 cells preinfected with Ad. The SB probe was used to protect the same RNA samples used for experiments shown in panel A. Asterisks indicate likely breakdown products of P5 protected fragments and were excluded from quantification. (C) There is a shift to the relative predominance of spliced AAV RNA species in 293 cells preinfected with Ad. The DH probe was used to protect the same RNA samples as used for experiments shown in panels A and B. Unspliced RNAs and spliced RNAs utilizing either A1 or A2 are indicated.
FIG. 4
FIG. 4
Analysis of AAV RNA stability and accumulation. (A) AAV RNAs are stable. The RP probe was used to protect AAV RNA exactly as described for Fig. 2A except that at 12 h after AAV-Ad coinfection 40 mM actinomycin D was added at time zero and RNA was isolated at indicated times after actinomycin D treatment (described in Materials and Methods). All AAV RNAs are present at high levels at the 6-h time point (Table 1). Comparison between lanes relied on equivalent loading conditions and multiple repetition of the experiment, since unpredictable effects of Ad on cellular RNAs precluded their use as an internal standard. u, unspliced; s, spliced. (B) AAV transcript accumulation over 1-h intervals during a productive AAV infection (RP probe). The RP probe was used to protect RNA exactly as for Fig. 2D except that Ad was preinfected for 12 h and total RNA was isolated at indicated time points after AAV infection at time zero. The asterisk indicates excess undigested RP probe. See panels D and E and Table 2 for quantification. (C) AAV transcript accumulation over 1-h intervals during a productive AAV infection (SB probe). The SB probe was used to protect the same RNA samples exactly as described for panel B. Asterisks indicate likely breakdown products pf P5 protected fragments and were excluded from quantification. See panels D and E and Table 2 for quantification. (D) P40-generated transcripts accumulate at a greater rate than P5- and P19-generated transcripts. P40 unspliced and spliced RNAs were quantified; values were combined and plotted versus combined quantified levels of P5 and P19 unspliced and spliced RNAs for each time point from the experiment shown in panel B. Rates were derived from these curves as described in Materials and Methods and are reported in Table 2. (E) P19-generated transcripts accumulate at a greater rate than P5-generated transcripts. Data from panel C are plotted exactly as in panel D and reported in Table 2.
FIG. 4
FIG. 4
Analysis of AAV RNA stability and accumulation. (A) AAV RNAs are stable. The RP probe was used to protect AAV RNA exactly as described for Fig. 2A except that at 12 h after AAV-Ad coinfection 40 mM actinomycin D was added at time zero and RNA was isolated at indicated times after actinomycin D treatment (described in Materials and Methods). All AAV RNAs are present at high levels at the 6-h time point (Table 1). Comparison between lanes relied on equivalent loading conditions and multiple repetition of the experiment, since unpredictable effects of Ad on cellular RNAs precluded their use as an internal standard. u, unspliced; s, spliced. (B) AAV transcript accumulation over 1-h intervals during a productive AAV infection (RP probe). The RP probe was used to protect RNA exactly as for Fig. 2D except that Ad was preinfected for 12 h and total RNA was isolated at indicated time points after AAV infection at time zero. The asterisk indicates excess undigested RP probe. See panels D and E and Table 2 for quantification. (C) AAV transcript accumulation over 1-h intervals during a productive AAV infection (SB probe). The SB probe was used to protect the same RNA samples exactly as described for panel B. Asterisks indicate likely breakdown products pf P5 protected fragments and were excluded from quantification. See panels D and E and Table 2 for quantification. (D) P40-generated transcripts accumulate at a greater rate than P5- and P19-generated transcripts. P40 unspliced and spliced RNAs were quantified; values were combined and plotted versus combined quantified levels of P5 and P19 unspliced and spliced RNAs for each time point from the experiment shown in panel B. Rates were derived from these curves as described in Materials and Methods and are reported in Table 2. (E) P19-generated transcripts accumulate at a greater rate than P5-generated transcripts. Data from panel C are plotted exactly as in panel D and reported in Table 2.
FIG. 5
FIG. 5
All AAV RNAs are transported efficiently to the cytoplasm. (A) Total and cytoplasmic RNAs purified at 16 and 24 h after AAV-Ad coinfection were examined using the RP probe in duplicate to control for experimental error. Each species of AAV RNA (indicated on the right [u, unspliced; s, spliced]) accumulates in the cytoplasm in a ratio similar to that found in total RNA preparations. Each species of AAV RNA is efficiently polyadenylated. The RP (B), SB (C), and DH (D) probes were used to protect 10 μg of total RNA purified from AAV-Ad-coinfected 293 cells and poly(A)+-containing RNA purified from 20 μg of the same total RNA preparations, as described in Materials and Methods. The ratio of AAV RNA species (indicated on the right of each panel) in poly(A)+-purified RNA is indistinguishable from that of total RNA pools for each probe. The asterisk indicates excess undigested DH probe.
FIG. 6
FIG. 6
(A) Plasmids expressing a recombinant AAV genome from different promoters are differentially effected by Ad. The RP probe was used to protect either total or cytoplasmic RNA (indicated at the top) isolated from 293 cells transfected with the SSV9 plasmid and either not infected or infected with Ad (MOI = 2 to 5) (indicated at the bottom). AAV RNA species are indicated at the right (u, unspliced; s, spliced). (B) In the presence of Ad, the ratio of spliced to unspliced AAV RNAs dramatically increases. The DH probe was used to protect total RNA isolated from 293 cells transfected with SSV9 and either not infected or infected with Ad (MOI = 2 to 5).

Similar articles

Cited by

References

    1. Berns K. Parvoviridae: the viruses and their replication. In: Fields B N, Knipe D M, Howley P M, editors. Fundamental virology. Philadelphia, Pa: Lippincott-Raven; 1996. pp. 1017–1041.
    1. Berns K I, Giraud C. Biology of adeno-associated virus. Curr Top Microbiol Immunol. 1996;218:1–23. - PubMed
    1. Buller R M, Janik J E, Sebring E D, Rose J A. Herpes simplex virus types 1 and 2 completely help adenovirus-associated virus replication. J Virol. 1981;40:241–247. - PMC - PubMed
    1. Carmer P, Pesce C G, Baralle F E, Kornblihtt A R. Functional association between promoter structure and transcript alternative splicing. Proc Natl Acad Sci USA. 1997;94:11456–11460. - PMC - PubMed
    1. Carter B J. Transcription. In: Ward D, Tattersall P, editors. Replication of mammalian proviruses. Cold Spring Harbor, N.Y: Cold Spring Harbor Laboratory; 1978. pp. 33–52.

Publication types

LinkOut - more resources