Comparative Study
. 2000 Oct 15;28(20):4029-36.
doi: 10.1093/nar/28.20.4029.

Automatic detection of conserved gene clusters in multiple genomes by graph comparison and P-quasi grouping

Affiliations
Comparative Study

Automatic detection of conserved gene clusters in multiple genomes by graph comparison and P-quasi grouping

W Fujibuchi et al. Nucleic Acids Res. .

Abstract

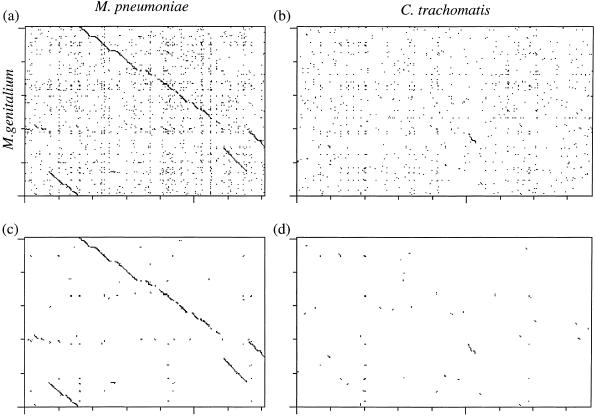
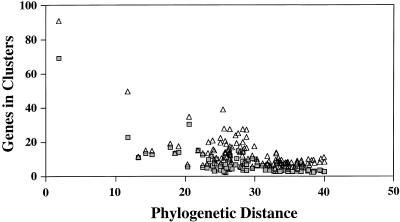
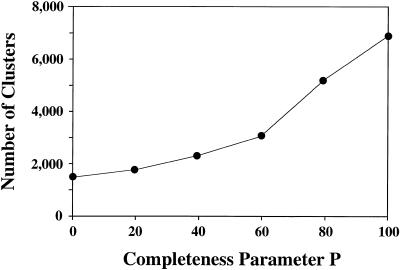
We previously reported two graph algorithms for analysis of genomic information: a graph comparison algorithm to detect locally similar regions called correlated clusters and an algorithm to find a graph feature called P-quasi complete linkage. Based on these algorithms we have developed an automatic procedure to detect conserved gene clusters and align orthologous gene orders in multiple genomes. In the first step, the graph comparison is applied to pairwise genome comparisons, where the genome is considered as a one-dimensionally connected graph with genes as its nodes, and correlated clusters of genes that share sequence similarities are identified. In the next step, the P-quasi complete linkage analysis is applied to grouping of related clusters and conserved gene clusters in multiple genomes are identified. In the last step, orthologous relations of genes are established among each conserved cluster. We analyzed 17 completely sequenced microbial genomes and obtained 2313 clusters when the completeness parameter P: was 40%. About one quarter contained at least two genes that appeared in the metabolic and regulatory pathways in the KEGG database. This collection of conserved gene clusters is used to refine and augment ortholog group tables in KEGG and also to define ortholog identifiers as an extension of EC numbers.


Figures

Figure 1
Figure 1
A schematic view of the entire procedure to extract conserved gene clusters in multiple genomes. (Step 1) A gene cluster pair is a group of related gene pairs that are located at contiguous positions in two genomes. An arrow indicates the best hit or the bi-directional best hit relation by SSEARCH. The similarity score of each gene cluster pair is defined by the smaller number of related genes (linked by arrows) in one genome. Thus, multiple links to the same node are counted just once. (Step 2) The cluster pairs are grouped by the P-quasi complete linkage method. The numbers indicate the scores retained from Step 1. (Step 3) Once a group of related gene clusters is obtained, the second P-quasi and the COG methods are used to establish the relationships of individual genes, including gene orders, orthologs, paralogs and fused genes.
Figure 2
Figure 2
The dot plot matrices representing the sequence similarity results by SSEARCH (upper) and the conserved cluster search results by our algorithm (lower) for pairwise comparisons of all protein coding genes between M.genitalium and M.pneumoniae (left) and between C.trachomatis and M.genitalium (right).
Figure 3
Figure 3
The percentage of genes in the conserved clusters relative to the total number of genes in the genome when two genomes are compared. The percentages for the larger (shaded boxes) and the smaller genome (open triangles) in the pairwise comparison are plotted against the phylogenetic distance between the two genomes according to the percent difference in small rRNA sequences.
Figure 4
Figure 4
The number of groups formed by merging related clusters is plotted against the completeness parameter P in a P-quasi complete linkage analysis. The parameter values of 100 and 0 correspond, respectively, to complete linkage and single linkage.
Figure 5
Figure 5
The gene cluster corresponding to the trp operon for tryptophan biosynthesis. (a) The gene cluster table computationally generated with P = 40% and (b) the manually refined table as represented in the KEGG ortholog group table. The columns in these tables represent groups of orthologous genes, which are annotated with the KEGG pathway map numbers and similarity weights in (a) and with the EC numbers in (b). The shading in (b) denotes possible operon structures, which is better viewed by the coloring at the KEGG web site (http://www.genome.ad.jp/kegg/ortholog/tab00400.html ). The gene names in parentheses are alternative names, except for HP1280 which contains a frameshift (no amino acid sequence). Eco, Escherichia coli; Hin, Haemophilus influenzae; Hpy, Helicobacter pylori; Bsu, Bacillus subtilis; Mtu, Mycobacterium tuberculosis; Ctr, Chlamydia trachomatis; Mja, Methanococcus jannashii; Mth, Methanobacterium thermoautotrophicum; Afu, Archaeoglobus fulgidus.

References

    1. Tatusov R.L., Mushegian,A.R., Bork,P., Brown,N.P., Hayes,W.S., Borodovsky,M., Rudd,K.E. and Koonin,V. (1996) Curr. Biol., 6, 279–291. - PubMed
    1. Watanabe H., Mori,H., Itoh,T. and Gojobori,T. (1997) J. Mol. Evol., 44, S57–S64. - PubMed
    1. Siefert J.L., Martin,K.A., Abdi,F., Widger,W.R. and Fox,G.E. (1997) J. Mol. Evol., 45, 467–472. - PubMed
    1. Tamames J., Casari,G., Ouzounis,C. and Valencia,A. (1997) J. Mol. Evol., 44, 66–73. - PubMed
    1. Dandekar T., Snel,B., Huynen,M. and Bork,P. (1998) Trends Biochem. Sci., 23, 324–328. - PubMed

Publication types

MeSH terms