. 2000 Oct 15;20(20):7672-81.
doi: 10.1523/JNEUROSCI.20-20-07672.2000.

Mice lacking specific nicotinic acetylcholine receptor subunits exhibit dramatically altered spontaneous activity patterns and reveal a limited role for retinal waves in forming ON and OFF circuits in the inner retina

Affiliations

Mice lacking specific nicotinic acetylcholine receptor subunits exhibit dramatically altered spontaneous activity patterns and reveal a limited role for retinal waves in forming ON and OFF circuits in the inner retina

A Bansal et al. J Neurosci. .

Abstract

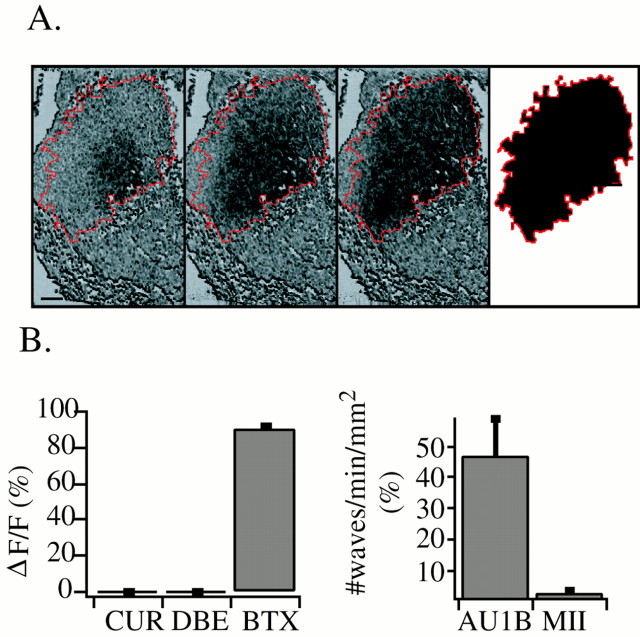
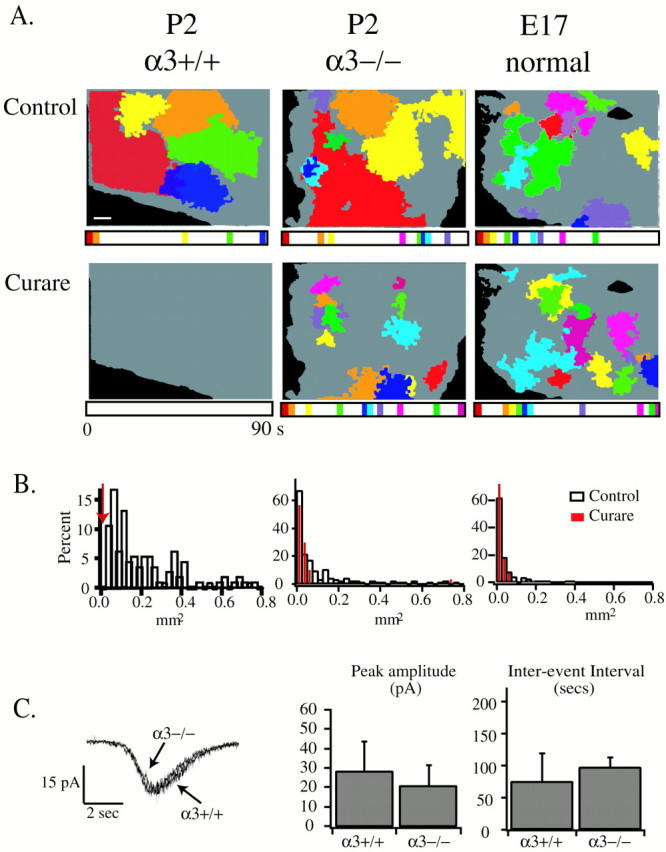
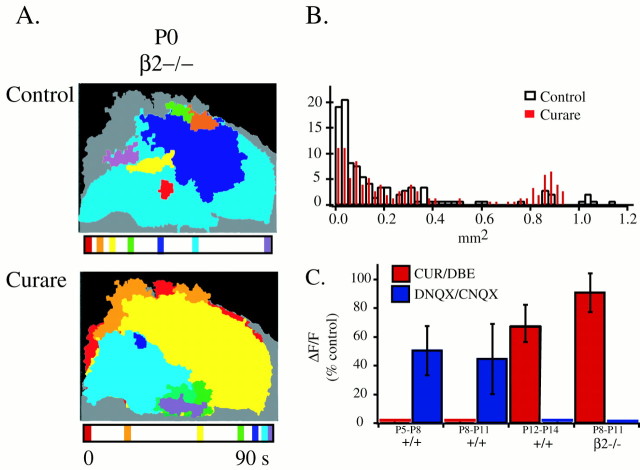
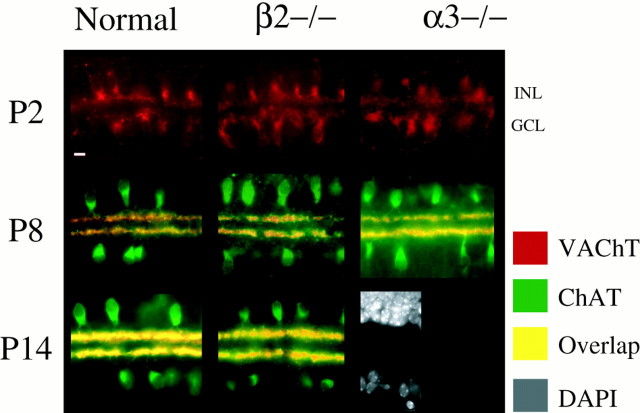
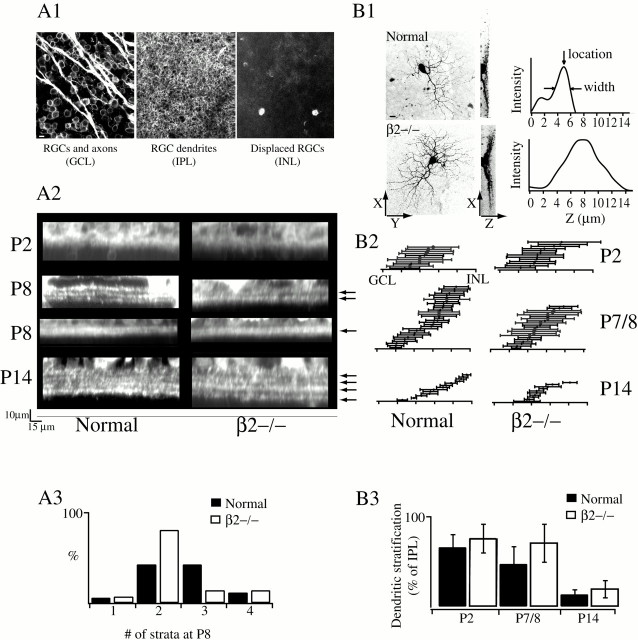
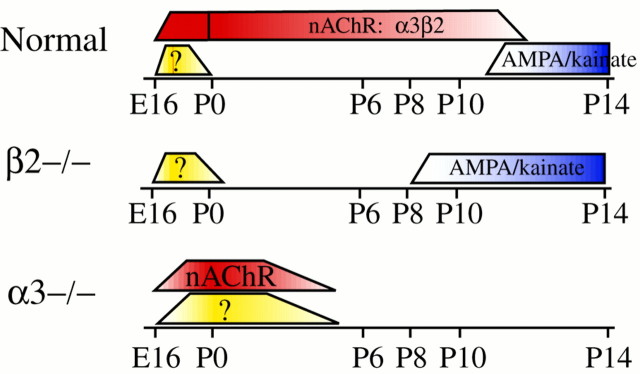
Before phototransduction, spontaneous activity in the developing mammalian retina is required for the appropriate patterning of retinothalamic connections, and there is growing evidence that this activity influences the development of circuits within the retina itself. We demonstrate here that the neural substrate that generates waves in the mouse retina develops through three distinct stages. First, between embryonic day 16 and birth [postnatal day 0 (P0)], we observed both large, propagating waves inhibited by nicotinic acetylcholine receptor (nAChR) antagonists and small clusters of cells displaying nonpropagating, correlated calcium increases that were independent of nAChR activation. Second, between P0 and P11, we observed only larger propagating waves that were abolished by toxins specific to alpha3 and beta2 subunit-containing nAChRs. Third, between P11 and P14 (eye opening) we observed propagating activity that was abolished by ionotropic glutamate receptor antagonists. The time course of this developmental shift was dramatically altered in retinas from mice lacking the beta2 nAChR subunit or the beta2 and beta4 subunits. These retinas exhibited a novel circuit at P0, no spontaneous correlated activity between P1 and P8, and the premature induction at P8 of an ionotropic glutamate receptor-based circuit. Retinas from postnatal mice lacking the alpha3 nAChR subunit exhibited spontaneous, correlated activity patterns that were similar to those observed in embryonic wild-type mice. In alpha3-/- and beta2-/- mice, the development and distribution of cholinergic neurons and processes and the density of retinal ganglion cells (RGCs) and the gross segregation of their dendrites into ON and OFF sublaminae were normal. However, the refinement of individual RGC dendrites is delayed. These results indicate that retinal waves mediated by nAChRs are involved in, but not required for, the development of neural circuits that define the ON and OFF sublamina of the inner plexiform layer.


Figures

Fig. 1.
Fig. 1.
Retinal waves in normal mice are mediated by nAChRs containing α3 and β2 subunits. A, Time evolution of a single retinal wave visualized with fluorescence imaging. Decreases in fura-2 fluorescence associated with the increased calcium evoked by waves are shown at successive 0.5 sec intervals. Thelast frame represents the “domain” of the wave, defined as the total area of tissue covered by a single wave.B, Spontaneous activity is blocked by toxins specific to nAChRs containing the α3 subunit. Left, Effects of 50–100 μm curare (CUR), 2 μm dihydrobetaerthroidine (DBE), and 200 nm α-bungarotoxin (BTX) on the fractional change in fluorescence, ΔF/F, averaged over 100 μm2 regions of P0–P6 retinas.Right, Effects of α-conotoxin-AU1B (AU1B) and α-conotoxin MII (MII) on the number of waves per minute per square millimeter. The collagenase treatment necessary for peptide penetration restricted wave propagation (see Materials and Methods) and made ΔF/F measurements in a small region a poor reflection of the overall activity level. Therefore, the conotoxin effects on wave activity were measured by counting the number of waves observed in the total imaged area in a 10 min period. Scale bar, 100 μm.
Fig. 2.
Fig. 2.
Waves in α3−/− mice have altered spatiotemporal properties. A, Retinal waves of postnatal wild-type (P2 α3+/+), α3−/− (P2), and embryonic (E17 normal) retinas. Each frame summarizes 90 sec of activity in control ACSF (top row) and in 100 μmd-tubocurarine (bottom row). Gray background represents the total retinal surface labeled with fura-2 AM. Each color corresponds to individual domains with a color-coded time bar below each frame to indicate the time of occurrence of each wave. Scale bar, 100 μm.B, Normalized distribution of domain sizes for the three classes of retinas pictured in A in control ACSF (open bars) and in d-tubocurarine (red lines). Bin size is 0.025 mm2. α3+/+ mice, n = 114 waves in control solutions, four retinas, three mice; α3−/− mice, n = 139 waves in control solutions; n = 93 ind-tubocurarine, three retinas, three mice; embryonic normal mice, n = 161 waves in control solutions;n = 30 in d-tubocurarine, three retinas, two mice. C, Retinal ganglion cells from α3−/− mice have periodic compound PSCs comparable with those of α3+/+ mice. Left, PSC recorded by whole-cell voltage clamp of RGCs in α3−/− and α3+/+ mice. Right, PSC peak amplitudes and inter-event intervals for α3+/+ (9 cells, 4 mice) and α3−/− (9 cells, 3 mice) mice.
Fig. 3.
Fig. 3.
β2−/− mice have altered retinal waves.A, Retinal waves of P0 β2−/− mice. Same configuration as Figure 2A. B, Normalized distribution of domain sizes for P0 β2−/− mice in control ACSF (open bars) and ind-tubocurarine (red lines). Bin size is 0.025 mm2. n = 115 waves in control solutions; n = 153 ind-tubocurarine, three retinas, three mice.C, Effects of nAChR antagonists [2 μmdihydrobetaerthroidine (DBE) or 100 μmd-tubocurarine (CUR)] and non-NMDA ionotropic glutamate receptor antagonists [25 μm6,7-dinitroquinoxaline-2,3-dione (DNQX) or 50 μm 6-cyano-7-nitroquinoxaline-2,3-dione (CNQX)] on ΔF/F averaged over 200 μm2 regions of retinas from P5–P14 normal and P8–P11 β2−/− mice.
Fig. 4.
Fig. 4.
Stratification of cholinergic neurons from P2 to P14 is normal in β2−/− and α3−/− mice. Transverse sections of mouse retinas immunostained for ChAT and VAChT are shown. P2 retinas are only stained for VAChT. Bottom right panel, DAPI-labeled neuronal somas in the INL (top) and GCL (bottom). Scale bar, 10 μm.
Fig. 5.
Fig. 5.
RGCs from β2−/− mice show slowed segregation into the adult strata pattern. A1, Confocal sections of DiI-labeled RGCs at different focal depths (GCL, IPL, and INL). Scale bar, 10 μm. A2, Cross-sectional projection of DiI reconstructions averaged over 250 μm of retina. Arrowsshow individual layers. Scale bar, 15 μm. At P8, examples of retinas that contained a single stratum are also shown. A3, Distribution of the number of strata in retinas from P8 normal and β2−/− mice. B1, Left, XY projection of 3-D-reconstructed, Lucifer yellow-filled RGCs from P8 normal and β2−/− mice. Scale bar, 10 μm. Middle,x–z projection of same cells. Right, Pixel intensity profiles of x–z projection averaged over the y-axis, normalized to maximum pixel intensity. The region containing the cell body has been excluded.B2, Lucifer yellow-filled RGCs in P2, P7–P8, and P14 retinas from normal and β2−/− mice. Cells are arranged by relative location in IPL, and error bars indicate the width of dendritic stratification (see location and width arrows inB1). B3, Widths of dendritic stratification for P2, P7–P8, and P14 normal and β2−/− mice. Stratification widths are normalized to the total width of the IPL. Error bars indicate SD.
Fig. 6.
Fig. 6.
Summary of development of the synaptic circuitry that mediates waves in normal, β2−/−, and α3−/− retinas. Eachcolor corresponds to a different wave-generating circuit: yellow corresponds to non-nAChR circuitry that mediates the nonpropagating events in embryonic normal and postnatal α3−/− mice and the propagating event in P0 β2−/− mice;red corresponds to circuits that require activation of nAChRs; and blue corresponds to circuits that require activation of ionotropic glutamate receptors. The wave-generating circuitry in α3−/− retinas was not studied in the second postnatal week because of the premature death of the transgenic mice.

References

    1. Aizenman E, Loring RH, Lipton SA. Blockade of nicotinic responses in rat retinal ganglion cells by neuronal bungarotoxin. Brain Res. 1990;517:209–214. - PubMed
    1. Baldridge WH. Optical recordings of the effects of cholinergic ligands on neurons in the ganglion cell layer of mammalian retina. J Neurosci. 1996;16:5060–5072. - PMC - PubMed
    1. Bisti S, Gargini C, Chalupa LM. Blockade of glutamate-mediated activity in the developing retina perturbs the functional segregation of ON and OFF pathways. J Neurosci. 1998;18:5019–5025. - PMC - PubMed
    1. Bodnarenko SR, Chalupa LM. Stratification of ON and OFF ganglion cell dendrites depends on glutamate-mediated afferent activity in the developing retina. Nature. 1993;364:144–146. - PubMed
    1. Bodnarenko SR, Jeyarasasingam G, Chalupa LM. Development and regulation of dendritic stratification in retinal ganglion cells by glutamate-mediated afferent activity. J Neurosci. 1995;15:7037–7045. - PMC - PubMed

Publication types

MeSH terms