. 2000 Oct 15;20(20):7743-51.
doi: 10.1523/JNEUROSCI.20-20-07743.2000.

Nav2/NaG channel is involved in control of salt-intake behavior in the CNS

Affiliations

Nav2/NaG channel is involved in control of salt-intake behavior in the CNS

E Watanabe et al. J Neurosci. .

Abstract

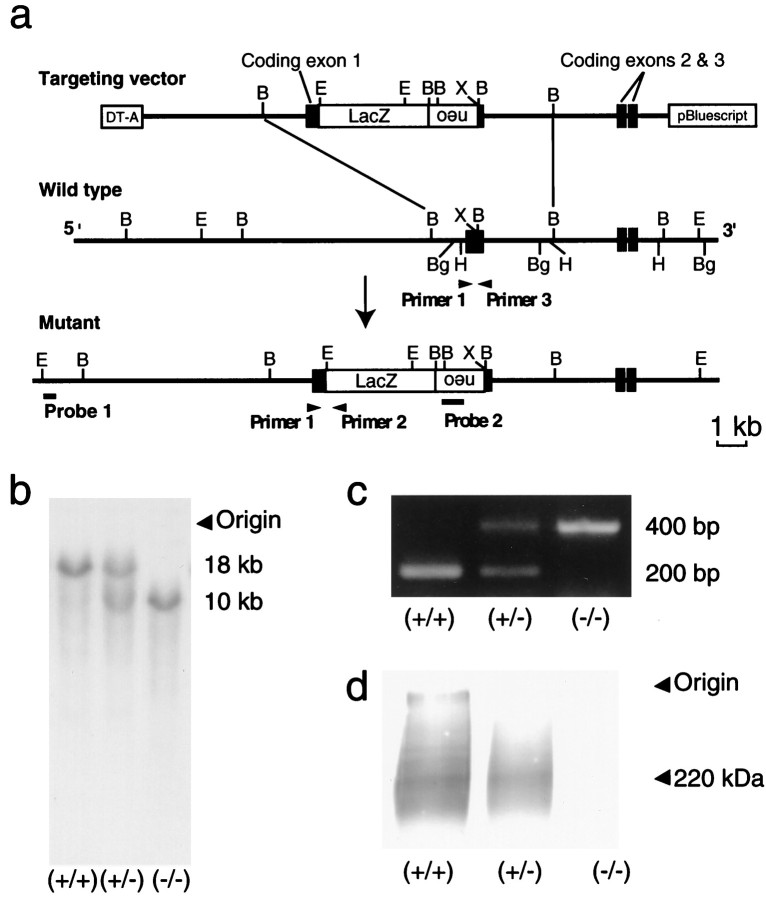
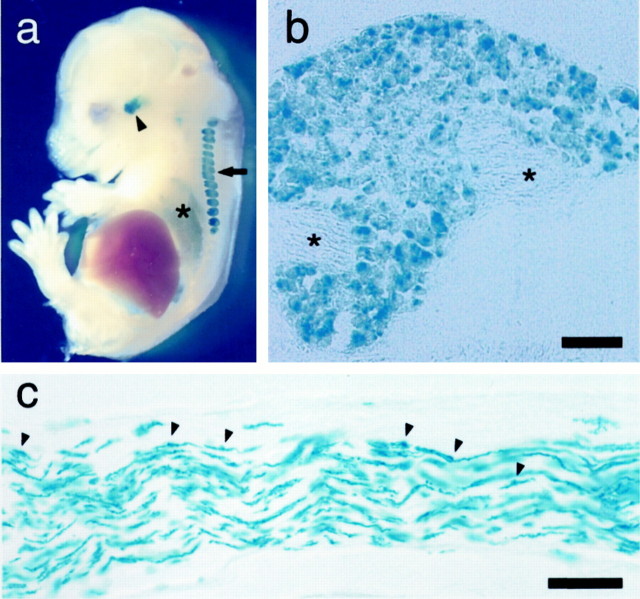
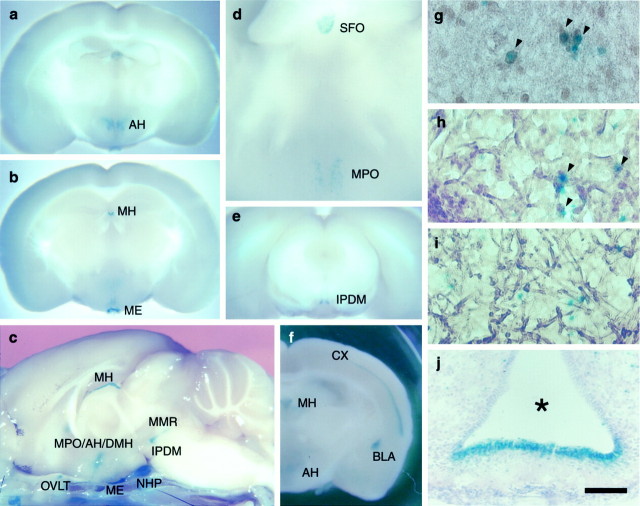
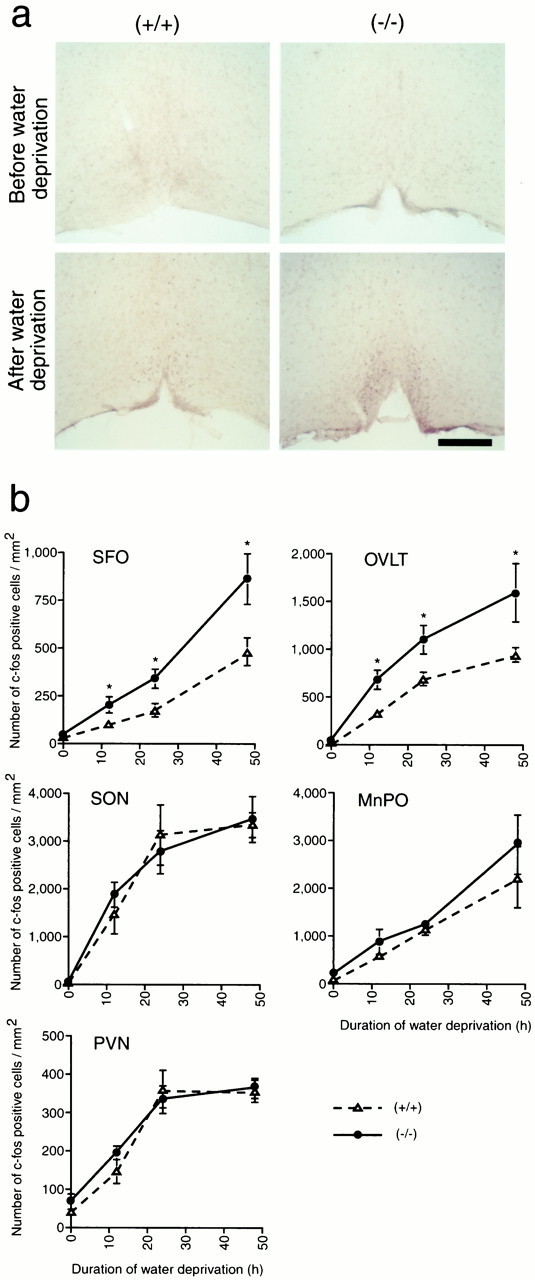
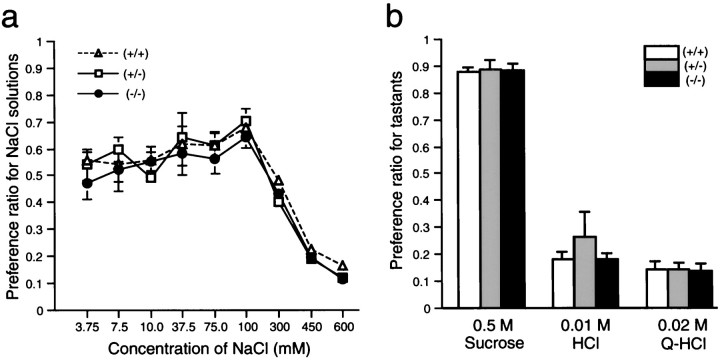
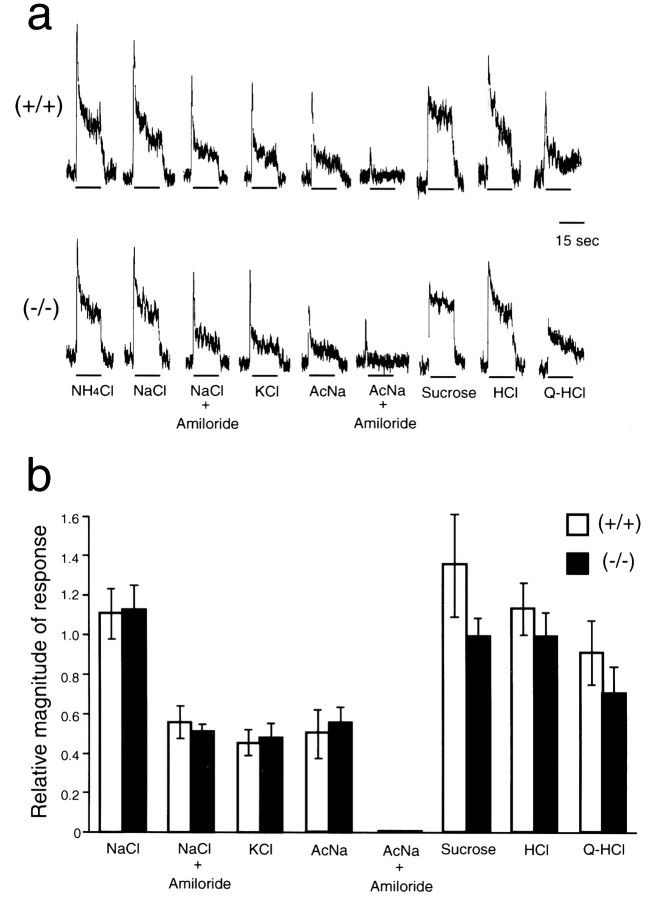
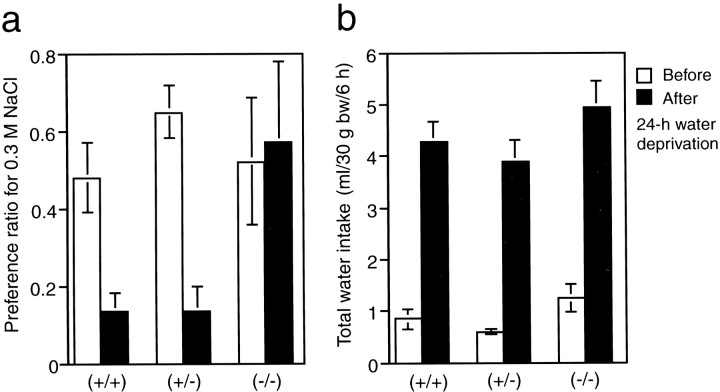
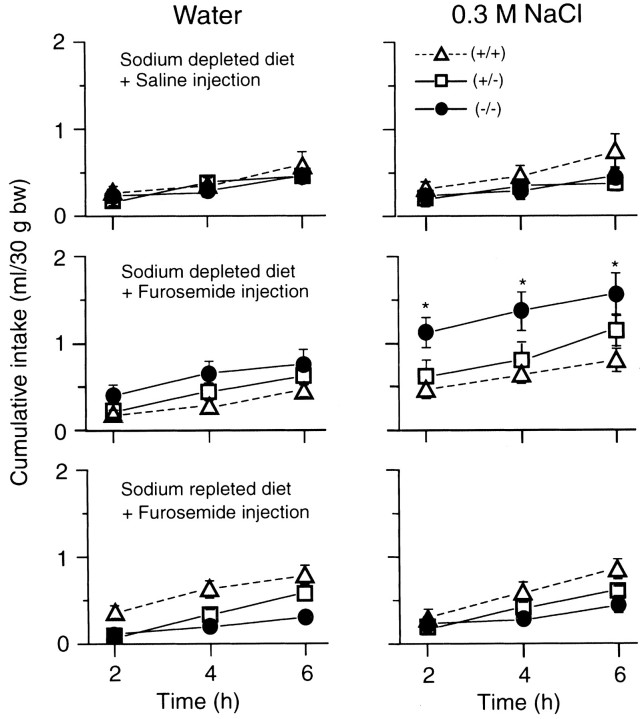
Na(v)2/NaG is a putative sodium channel, whose physiological role has long been an enigma. We generated Na(v)2 gene-deficient mice by inserting the lacZ gene. Analysis of the targeted mice allowed us to identify Na(v)2-producing cells by examining the lacZ expression. Besides in the lung, heart, dorsal root ganglia, and Schwann cells in the peripheral nervous system, Na(v)2 was expressed in neurons and ependymal cells in restricted areas of the CNS, particularly in the circumventricular organs, which are involved in body-fluid homeostasis. Under water-depleted conditions, c-fos expression was markedly elevated in neurons in the subfornical organ and organum vasculosum laminae terminalis compared with wild-type animals, suggesting a hyperactive state in the Na(v)2-null mice. Moreover, the null mutants showed abnormal intakes of hypertonic saline under both water- and salt-depleted conditions. These findings suggest that the Na(v)2 channel plays an important role in the central sensing of body-fluid sodium level and regulation of salt intake behavior.


Figures

Fig. 1.
Fig. 1.
Targeted disruption ofmNav2 gene. a, Restriction maps of the targeting vector (top), endogenousmNav2 gene locus (middle), and recombinant gene locus (bottom). The protein-coding exons are indicated asclosed boxes. Targeted insertion of thelacZ-neo cassette into the first protein-coding exon was accomplished using the targeting vector. Restriction sites shown are as follows: B, BamHI; Bg,BglII; E, EcoRI;H, HindIII; and X,XhoI. b, Southern blot analysis of genomic DNA digested with EcoRI. Samples are derived from tails of wild-type (+/+), heterozygous (+/−), and homozygous (−/−) mice. Blotted membranes were hybridized with probe 1 located outside of the 5′ terminus of the targeting vector. The sizes for the wild-type (18 kb) and recombinant (10 kb) genotypes are shown on theright. The insertion was verified by using probe 2 located inside the targeting vector. c, Genomic PCR analysis of wild-type, heterozygous, and homozygous mutant mice. The sizes for the wild-type (200 bp) and recombinant (400 bp) genotypes are shown on the right. d, Western blot analysis using anti-mNav2 polyclonal antibody. Samples were prepared from the lungs of wild-type, heterozygous, and homozygous mutant mice. The position of the channel protein (220 kDa) is indicated on the right. The sodium channel gave a broad signal, because the protein is highly glycosylated and readily aggregates even in the SDS-containing buffer.
Fig. 2.
Fig. 2.
The distribution pattern of lacZexpression in the peripheral organs. a,LacZ expression in whole-mount E15 embryos ofmNav2+/− mice. E15 embryo was cut midsagittally and then stained with X-Gal. Theblue signals represent the site expressinglacZ. The arrow points to DRGs, thearrowhead points to a trigeminal ganglion, and theasterisk shows the lung. b, An X-Gal-stained cryostat tissue section of dorsal root ganglion of postnatal day 2mNav2+/−mice. Nerve tracts are shown by asterisks.c, A cryostat section of adult sympathetic nerve trunk in the thoracic region. Based on the appearance, distribution, and size of the cell bodies, the numerous intensely stained cells are likely to be Schwann cells. Arrowheads identify the somata of Schwann cells. Scale bar, 50 μm.
Fig. 3.
Fig. 3.
mNav2 was expressed in specialized neurons and ependymal cells in the adult CNS.LacZ expression in the CNS ofmNav2+/−(a–e) andmNav2/−(f) mutant mice. Fixed adult brains were cut coronally at 2 mm (a, b, d–f) or into halves midsagittally (c) and then stained with X-Gal. Inc, the skull under the brain was not removed. Ine, homozygous mutant mice were used for the analysis to detect the locus of low-level expression. AH, Anterior hypothalamic area; MH, medial habenular nucleus;ME, median eminence; OVLT, organum vasculosum laminae terminalis; MPO, medial preoptic area;DMH, dorsomedial hypothalamus; IPDM, interpeduncular nucleus of the dorsomedial part; MMR, medial part of the median raphe; NHP, neurohypophysis;SFO, subfornical organ; CX, cerebral cortex;BLA, basolateral amygdala. In c, OVLT was removed from the CNS and attached to the skull. The coronal semi-whole-mount brains were cut 50-μm-thick using cryostat microtome and then stained with anti-neurofilament (g, h), anti-GFAP (i) polyclonal antibodies, or cresyl violet (j). Brown signals are the site that reacted with the antibodies. The samples are AH (g), SFO (h,i), and ME (j). Arrowheads indicate double-positive neurons. The asterisk in j indicates the third ventricle. The dorsal side is toward the top of the panels. Scale bar: g–i, 30 μm; j, 100 μm.
Fig. 4.
Fig. 4.
Abnormal increases of Fos-immunopositive nuclei were selectively observed in the SFO and OVLT of the null mutants under conditions of thirst. Wild-type or null mutant mice were dehydrated for 0, 12, 24, and 48 hr, and then fixed. The fixed brains were cut coronally into 50-μm-thick sections and then stained with anti-Fos polyclonal antibody. a, Typical examples of tissue sections containing the OVLT derived from euhydrated or 24 hr dehydrated wild-type (+/+) and null mutant (−/−) mice. Scale bar, 200 μm. b, Mean numbers of Fos-immunopositive cells per square millimeter in the SFO, OVLT, SON, PVN, and MnPO during water deprivation were plotted. Vertical bars indicate SE. *ttest analyses revealed a significant difference (p < 0.05) betweenmNav2/−and mNav2+/+mice.
Fig. 5.
Fig. 5.
The null mutants showed normal preferences to various tastants under the condition satiated with water and salt. Preference ratios for NaCl solutions with a series of concentrations (a) or three fundamental tastants with fixed concentrations (b) were examined by a 48 hr two-bottle preference test. n = 5 (+/+), 5 (+/−), and 5 (−/−). Vertical bars indicate SE.
Fig. 6.
Fig. 6.
Normal responses to various tastant stimuli in the chorda tympani nerve of the null mutants. a, Sample recording of the integrated chorda tympani responses to (in m): 0.1 ammonium chloride (NH4Cl), 0.1 sodium chloride (NaCl), 0.1 NaCl with 0.1 mm amiloride, 0.1 KCl, 0.1 sodium acetate (AcNa), 0.1 AcNa with 0.1 mm amiloride, 0.5 sucrose, 0.01 hydrochloric acid (HCl), and 0.02 quinine hydrochloride (Q-HCl) in the wild-type and mNav2 null mutant mice. b, Mean magnitude of responses to various taste stimuli. The values are expressed relative to the magnitude of the response to 0.1 m NH4Cl.n = 4 (+/+) and 5 (−/−).
Fig. 7.
Fig. 7.
The null mutants showed an abnormal ingestion of hypertonic saline under the thirst condition. Preference ratio for 0.3m NaCl solution (a) and total fluid intake (b) per 6 hr was measured before and after 24 hr dehydration; n = 6 (+/+), 6 (+/−), and 6(−/−). Vertical bars indicate SE. *t test analyses revealed a significant difference (p < 0.05) betweenmNav2/−and mNav2+/+mice.
Fig. 8.
Fig. 8.
The null mutants showed an excessive ingestion of hypertonic saline under the acute salt appetite condition. An acute salt appetite was induced by feeding a sodium-depleted diet combined with furosemide injection intraperitoneally. As a control, normal saline was injected intraperitoneally instead of the furosemide solution. As another control, a sodium-containing diet was given instead of the sodium-depleted diet. The behavioral study was sequentially performed on alternate days as follows: sodium-depleted diet combined with normal saline injection (top), sodium-depleted diet combined with furosemide injection (middle), and sodium-repleted diet combined with furosemide injection (bottom). Mean cumulative intakes of 0.3m NaCl (right) and water (left) per 2 hr on the day just after each experimental procedure were plotted; n = 10 (+/+), 10 (+/−), and 10 (−/−). Vertical bars indicate SE. *t test analyses revealed a significant difference (p < 0.05) betweenmNav2/−and mNav2+/+mice.

References

    1. Akopian AN, Souslova V, Sivilotti L, Wood JN. Structure and distribution of a broadly expressed atypical sodium channel. FEBS Lett. 1997;400:183–187. - PubMed
    1. Andersson B. Regulation of water intake. Physiol Rev. 1978;58:582–603. - PubMed
    1. Bachmanov AA, Tordoff MG, Beauchamp GK. Voluntary sodium chloride consumption by mice: differences among five inbred strains. Behav Genet. 1998;28:117–124. - PMC - PubMed
    1. Birmingham MK, Sar M, Stumpf WE. Localization of aldosterone and corticosterone in the central nervous system, assessed by quantitative autoradiography. Neurochem Res. 1984;9:333–350. - PubMed
    1. Bourque CW, Oliet SH. Osmoreceptors in the central nervous system. Annu Rev Physiol. 1997;59:601–619. - PubMed

Publication types

MeSH terms

Associated data