. 2000 Nov;20(21):7881-92.
doi: 10.1128/MCB.20.21.7881-7892.2000.

In yeast, the 3' untranslated region or the presequence of ATM1 is required for the exclusive localization of its mRNA to the vicinity of mitochondria

Affiliations

In yeast, the 3' untranslated region or the presequence of ATM1 is required for the exclusive localization of its mRNA to the vicinity of mitochondria

M Corral-Debrinski et al. Mol Cell Biol. 2000 Nov.

Abstract

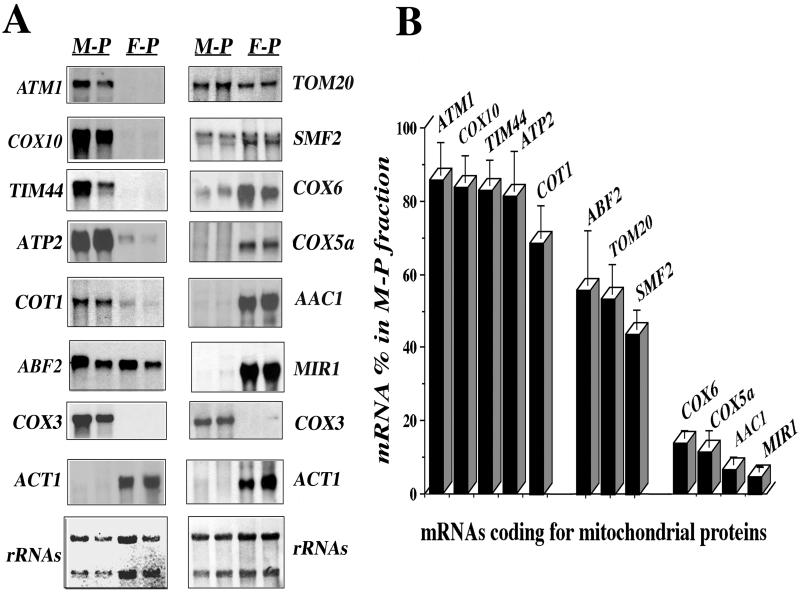
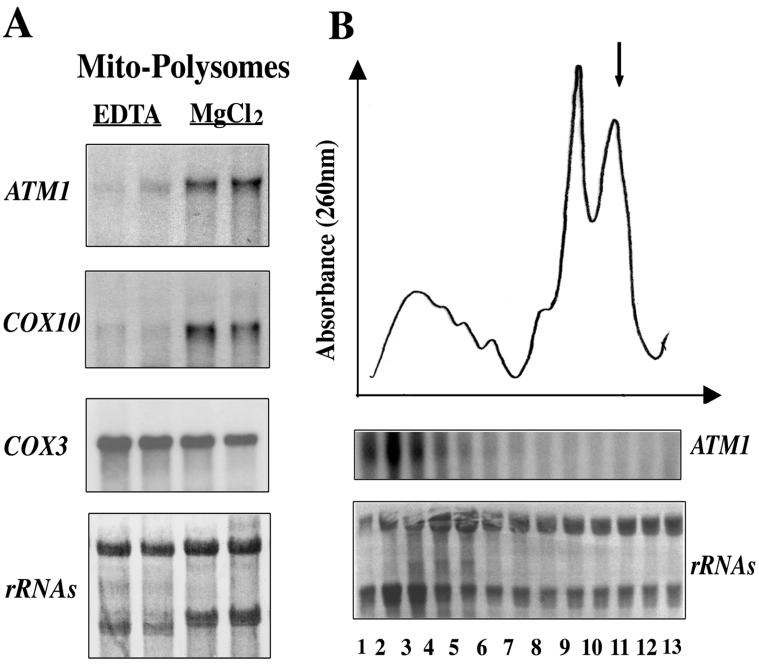
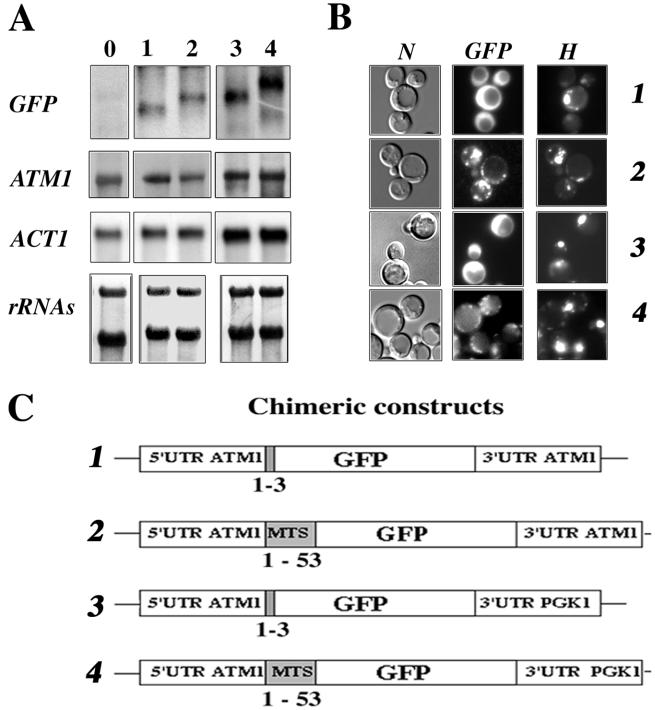
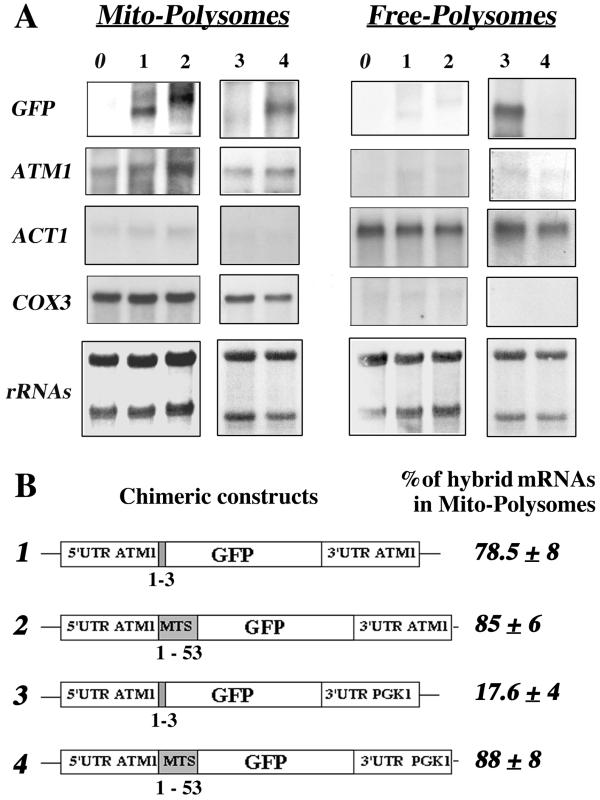
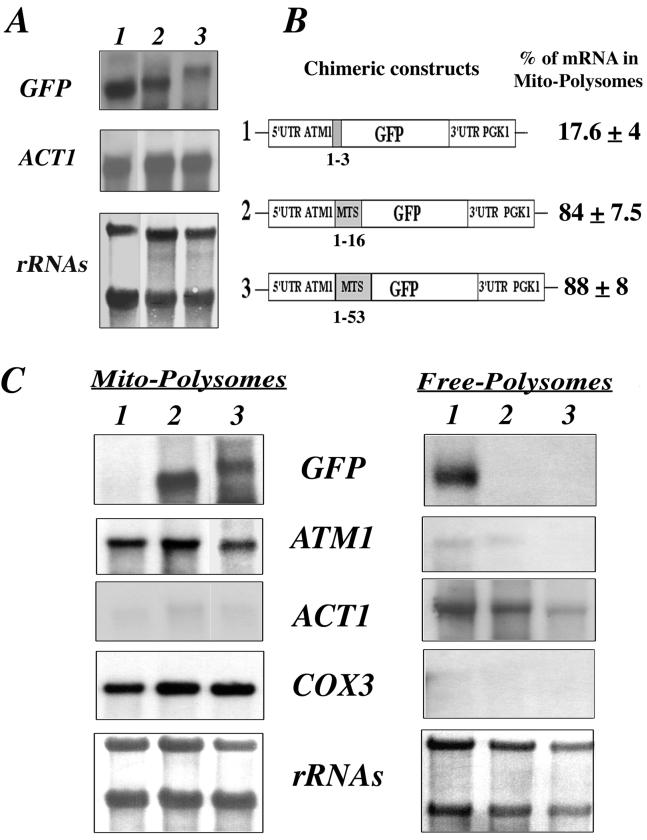
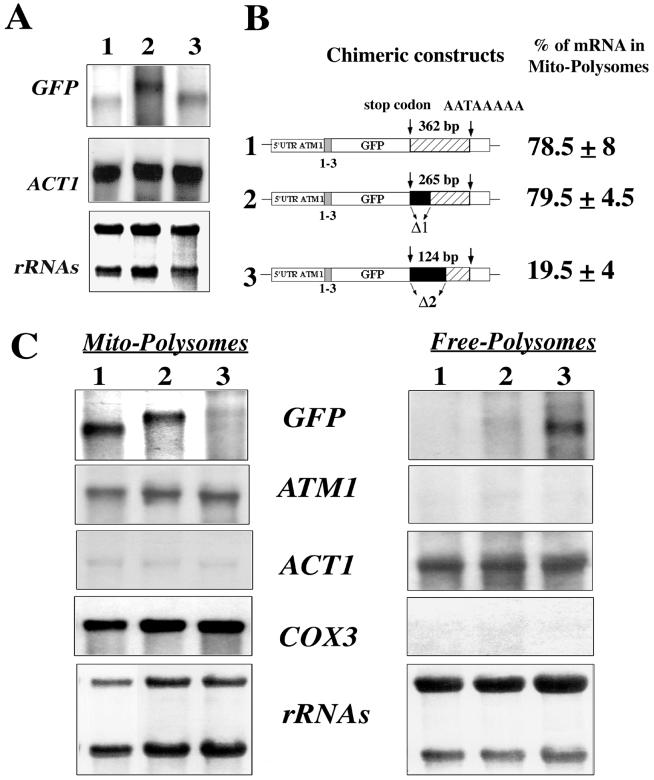
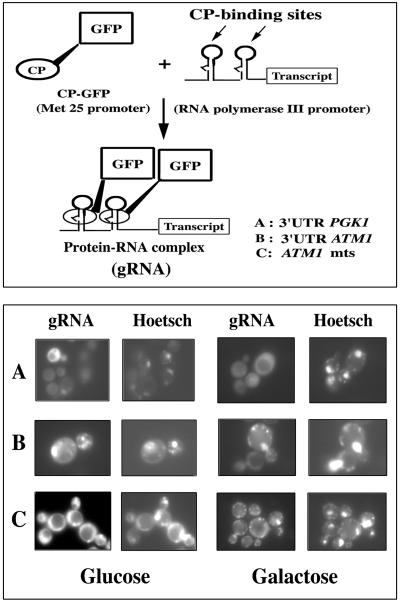
We isolated mitochondria from Saccharomyces cerevisiae to selectively study polysomes bound to the mitochondrial surface. The distribution of several mRNAs coding for mitochondrial proteins was examined in free and mitochondrion-bound polysomes. Some mRNAs exclusively localize to mitochondrion-bound polysomes, such as the ones coding for Atm1p, Cox10p, Tim44p, Atp2p, and Cot1p. In contrast, mRNAs encoding Cox6p, Cox5a, Aac1p, and Mir1p are found enriched in free cytoplasmic polysome fractions. Aac1p and Mir1p are transporters that lack cleavable presequences. Sequences required for mRNA asymmetric subcellular distribution were determined by analyzing the localization of reporter mRNAs containing the presequence coding region and/or the 3'-untranslated region (3'UTR) of ATM1, a gene encoding an ABC transporter of the mitochondrial inner membrane. Biochemical analyses of mitochondrion-bound polysomes and direct visualization of RNA localization in living yeast cells allowed us to demonstrate that either the presequence coding region or the 3'UTR of ATM1 is sufficient to allow the reporter mRNA to localize to the vicinity of the mitochondrion, independently of its translation. These data demonstrate that mRNA localization is one of the mechanisms used, in yeast, for segregating mitochondrial proteins.


Figures

FIG. 1
FIG. 1
Asymmetric distribution of mRNAs coding for mitochondrial imported proteins among free and mitochondrion-bound polysomes. (A) CW04 cells were grown aerobically (rich galactose medium) and harvested in early log phase; free polysomes (F-P) and mitochondrion-bound polysomes (M-P) were prepared at pH 7.4 as described in Materials and Methods. Their RNA was extracted and subjected to Northern blot analysis, using probes for different genes encoding mitochondrial proteins. Cross-contamination of the fractions was checked with the ACT1 gene as a cytoplasmic protein control and the COX3 gene as a mitochondrial protein control. Results obtained for two individual RNA preparations are shown; at the bottom, methylene blue staining of the filters is shown. The approximate sizes measured for individual mRNAs were as follows: ATM1, 2.2 kb; COX10, 1.7 kb; TIM44, 1.5 kb; ATP2, 1.6 kb; COT1, 1.5 kb; ABF2, 0.6 kb; COX3, 3.7 kb; ACT1, 1.7 kb; TOM20, 0.8 kb; SMF2, 1.9 kb; COX6, 0.6 kb; COX5a, 0.6 kb; AAC1, 1.1 kb; and MIR1, 1.2 kb. (B) Densitometric analyses of the results obtained with 12 independent polysome preparations were performed. A signal obtained for an individual transcript in the RNA preparation from mitochondrion-bound polysomes was normalized with the COX3 mRNA signal. The normalization for the signal in the free-polysome fraction was performed with the ACT1 mRNA signal. For a given mRNA, addition of specific signals measured in mitochondrion-bound polysomes and in free polysomes after normalization was considered as 100%. The percentage of mRNA signal found in mitochondrion-bound polysomes is shown for the 12 genes examined.
FIG. 2
FIG. 2
The ATM1 transcript is specifically associated with mitochondrion-bound polysomes. (A) Northern blots were performed with RNA prepared from EDTA-treated mitochondria in MgCl2-free buffers (EDTA) or from untreated mitochondria in buffers containing 5 mM MgCl2 and 100 mM KCl (MgCl2). In the presence of EDTA, polysomes attached to mitochondria were washed off. This finding is visible after staining of the filter with methylene blue (shown at the bottom): the 18S rRNA band is strongly diminished, and the 16S rRNA band representing the mitochondrial specie is clearly distinguished. In these preparations, approximately 90% of the ATM1 and COX10 mRNA signal disappeared. (B) Fifty A260 units of cytoplasmic polysomes released from mitochondria, after Triton X-100 treatment, were sedimented in a linear sucrose gradient. The gradients were scanned at 260 nm, and fraction 1 is the bottom of the gradient. An arrow (upper panel) indicates the position of the 80S monosomes. Thirteen fractions were collected from each gradient to prepare RNA and then subjected to Northern blot analysis using ATM1 radiolabeled DNA (lower panel). The patterns obtained for polysomes released from mitochondria are very similar to the ones described by Suissa and Schatz (57). Furthermore, the profile of ATM1 mRNA is consistent with its almost exclusive association with polysomes containing four or more ribosomes. Very low levels of ATM1 signal were found in the 80S monosome fraction. Methylene blue staining of the filter is shown at the bottom.
FIG. 3
FIG. 3
Expression and localization of GFP-Atm1p chimeras. (A) A portion (30 μg) of RNA prepared from whole cells was separated on formaldehyde-agarose gels and subjected to Northern blot analysis using specific radiolabeled probes. Lane 0 represents CW04 wild-type cells devoid of recombinant plasmids, and lanes 1 to 4 represent CW04 cells expressing plasmids 1 to 4, respectively, shown in panel C. The approximate sizes of each individual GFP hybrid mRNA were as follows: plasmid 1, 0.75 kb; plasmid 2, 0.9 kb; plasmid 3, 0.9 kb; and plasmid 4, 1.1 kb. (B) Direct fluorescence microscopy of CW04 cells carrying plasmids expressing the GFP chimeras. Panel N represents the cells viewed by Nomarski optics, panel GFP represents the GFP signal, and panel H shows cells stained with the DNA dye reagent Hoechst. Cells carrying plasmids 1 and 3 had homogeneous cytosolic staining, in contrast to cells carrying plasmids 2 and 4, which gave a cytoplasmic GFP signal localized to discrete spots, which were also stained by the DNA reagent Hoechst. (C) Representation of the four chimeric constructs tested. GFP protein is expressed under the control of ATM1 promoter. All of the plasmids shared the complete 5′UTR of ATM1, and translation for all them was initiated at the authentic Atm1p AUG. For plasmids 1 and 3, the GFP AUG is in the fourth position of the chimeras. In contrast, fusion proteins translated from plasmids 2 and 4 possess the entire Atm1p 53-amino-acid presequence in frame with the GFP AUG codon. In plasmids 3 and 4, the 3′UTR of ATM1 was replaced with the 3′UTR of PGK1, a gene coding for a cytoplasmic protein and usually used as a marker of soluble cytosolic fractions (52).
FIG. 4
FIG. 4
ATM1 sequences required for the asymmetric subcellular distribution of GFP hybrid mRNAs. (A) Wild-type CW04 cells (lane 0) or cells carrying the four plasmids (lanes 1 to 4) described in Fig. 3 C were grown until early log phase and harvested in order to purify free and mitochondrion-bound polysomes (see Materials and Methods). Then, 10 μg of RNA extracted from each polysomal fraction was separated on formaldehyde-agarose gels, subjected to Northern blot analysis, and hybridized successively with GFP, ATM1, ACT1, and COX3 probes. Methylene blue staining of the filters is shown at the bottom. Results obtained for RNA prepared from mitochondrion-bound polysomes (Mito-Polysomes) are shown in the left panel, and those obtained from free cytoplasmic polysomes (Free-Polysomes) are shown in the right panel. The autoradiograms represent exposure times of between 2 and 4 h at −80°C, with Amersham intensifying screens, for all the probes except ATM1, which required an exposure time of approximately 16 h. (B) Chimeric constructs are represented, as well as the percentage of the hybrid mRNA signal measured in polysomes bound to mitochondria, given as a mean of six independent experiments. In all cases, the presence of the ATM1 mts or its 3′UTR allowed the GFP hybrid mRNA to behave, with respect to its final subcellular localization, as the endogenous ATM1 mRNA.
FIG. 5
FIG. 5
Minimal region within the mts of Atm1p required for the correct localization of GFP hybrid mRNAs. (A) Three plasmids in which the GFP was fused in frame either with the complete mts of Atm1p or with shortened mts versions were obtained. RNA extracted from whole cells was checked by Northern blot analysis. The steady-state levels of each hybrid mRNA were very similar, and the sizes measured were as expected. The approximate size for each individual mRNA was as follows: plasmid 1, 0.9 kb; plasmid 2, 1 kb; and plasmid 3, 1.1 kb. (B) Chimeric constructs examined are represented. In plasmid 1 the GFP was fused in frame to the first three amino acids of Atm1p, in plasmid 2 the first 16 amino acids of Atm1p were fused to the GFP, and in plasmid 3 the complete mts was present. In all of the plasmids, the stop codon was associated with the 3′UTR of the PGK1 gene. Calculations of the relative abundance of each mRNA in mitochondrion-bound polysomes, for six independent experiments, were obtained after the normalization of each signal with the internal markers COX3 or ACT1. (C) Northern blots performed with RNAs purified from mitochondrion-bound polysomes (Mito-Polysomes) and free cytoplasmic polysomes (Free-Polysomes) are shown. Methylene blue staining of the filters is shown at the bottom. The autoradiograms represent exposures times of between 2 and 4 h at −80°C, with Amersham intensifying screens, for all of the probes except ATM1, which required an exposure time of approximately 16 h.
FIG. 6
FIG. 6
Minimal region within the 3′UTR of ATM1 required for the correct localization of GFP hybrid mRNAs. (A) Northern blots were performed using RNA extracted from whole cells carrying plasmids in which the regions between the stop codon and the canonical polyadenylation signal sequence AATAAA was shortened by 238 and 97 nucleotides, respectively. The steady-state levels of these individual mRNAs were quite similar in all of the cells tested. The approximate sizes for each hybrid mRNA were as follows: plasmid 1, 0.7 kb; plasmid 2, 1 kb; and plasmid 3, 0.8 kb. (B) Two plasmids were constructed in which deletions of the ATM1 3′UTR were performed. In plasmid 1 the complete 507 bp region of the 3′UTR was associated with the stop codon; the stop codon and the canonical polyadenylation signal sequence AATAAA are separated in this plasmid by 362 nucleotides. In plasmids 2 and 3, 97 and 238 nucleotides, respectively, shortened the region between the stop codon and the AATAAA signal. In all three chimeric constructs, the GFP is associated in frame with the first three amino acids of Atm1p. Calculations of the relative abundance of each transcript in mitochondrion-bound polysomes, for six independent experiments, were obtained after the normalization of each signal with the internal markers COX3 or ACT1. (C) Northern blots performed with RNAs purified from mitochondrion-bound polysomes (Mito-Polysomes) and free cytoplasmic polysomes (Free-Polysomes). Methylene blue staining of the filters is shown at the bottom. The autoradiograms represent exposures times of between 2 and 4 h at −80°C, with Amersham intensifying screens, for all of the probes except ATM1, which required an exposure time of approximately 16 h.
FIG. 7
FIG. 7
gRNAATM1 transcripts localized to the mitochondrial vicinity in living yeast cells. (Upper panel) The RNA-labeling system contains two components: the RNA binding MS2 CP fused to the GFP (CP-GFP) and an RNA transcript containing two CP-binding sites (7). The CP-binding sites were fused to the complete 3′UTR of PGK1 (A), the complete 3′UTR of ATM1 (B), and the nucleotide sequence coding for the first 53 amino acids of Atm1p (C). When coexpressed in the cell, the two components interact to form a GFP-labeled RNA (gRNA) which can be visualized using common fluorescence microscopy techniques. (Lower panel) We generated gRNAATM1 by placing either the entire 3′UTR of ATM1 (B) or the sequence corresponding to the Atm1p's mts (C) downstream of the CP-binding sites. Coexpression of CP-GFP and ATM1 reporter RNAs produces spots of fluorescence, which colocalize with the Hoechst cytoplasmic labeling. The discrete GFP fluorescent spots distinguished are very similar to the chondriolites, previously described as representing mitochondrial DNA (41, 55, 60). We were able to visualize arrangement changes of chondriolites by using Hoechst staining in cells that had grown in 2% galactose (galactose) instead of 2% glucose (glucose); gRNAATM1 remarkably followed the same cytoplasmic distribution as mitochondrial DNA. In contrast, the gRNA containing the PGK1 3′UTR consistently showed a homogeneous staining all over the cytoplasm (A).

Similar articles

Cited by

References

    1. Achleitner G, Gaigg B, Krasser A, Kainersdorfer E, Kohlwein S D, Perktold A, Zellnig G, Daum G. Association between the endoplasmic reticulum and mitochondria of yeast facilitates interorganelle transport of phospholipids through membrane contact. Eur J Biochem. 1999;264:545–553. - PubMed
    1. Ades I Z, Butow R A. The products of mitochondria-bound cytoplasmic polysomes in yeast. J Biol Chem. 1980;255:9918–9924. - PubMed
    1. Ades I Z, Butow R A. The transport of proteins into yeast mitochondria. J Biol Chem. 1980;255:9925–9935. - PubMed
    1. Banroques J, Delahodde A, Jacq C. A mitochondrial RNA maturase gene transferred to the yeast nucleus can control mitochondrial mRNA splicing. Cell. 1986;46:837–844. - PubMed
    1. Barnes W M. PCR amplification of up to 35 kb DNA with high fidelity and high yield from lambda bacteriophage templates. Proc Natl Acad Sci USA. 1994;91:2216–2220. - PMC - PubMed

Publication types

MeSH terms

LinkOut - more resources