. 2000 Nov;20(21):8157-67.
doi: 10.1128/MCB.20.21.8157-8167.2000.

Regulatory networks revealed by transcriptional profiling of damaged Saccharomyces cerevisiae cells: Rpn4 links base excision repair with proteasomes

Affiliations

Regulatory networks revealed by transcriptional profiling of damaged Saccharomyces cerevisiae cells: Rpn4 links base excision repair with proteasomes

S A Jelinsky et al. Mol Cell Biol. 2000 Nov.

Abstract

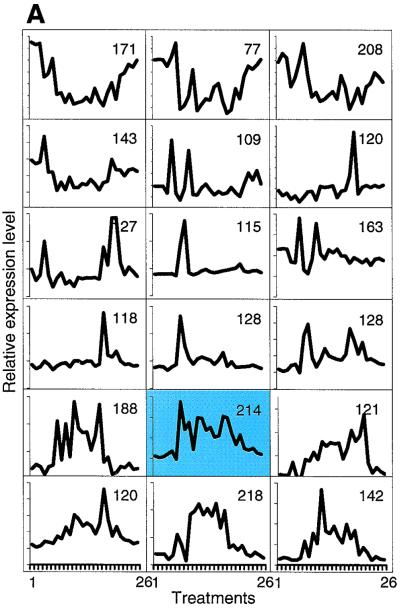
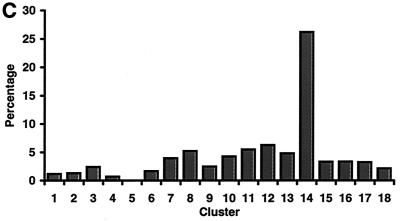
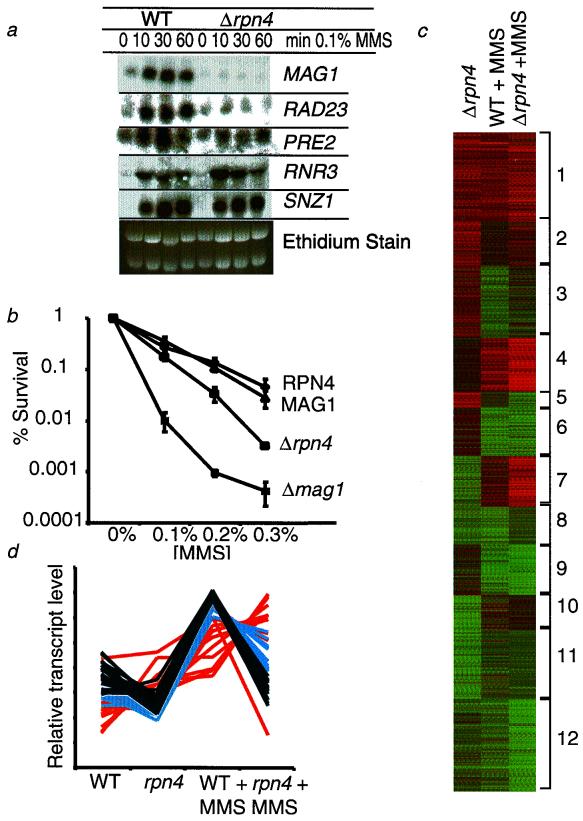
Exposure to carcinogenic alkylating agents, oxidizing agents, and ionizing radiation modulates transcript levels for over one third of Saccharomyces cerevisiae's 6,200 genes. Computational analysis delineates groups of coregulated genes whose upstream regions bear known and novel regulatory sequence motifs. One group of coregulated genes contain a number of DNA excision repair genes (including the MAG1 3-methyladenine DNA glycosylase gene) and a large selection of protein degradation genes. Moreover, transcription of these genes is modulated by the proteasome-associated protein Rpn4, most likely via its binding to MAG1 upstream repressor sequence 2-like elements, that turn out to be almost identical to the recently identified proteasome-associated control element (G. Mannhaupt, R. Schnall, V. Karpov, I. Vetter, and H. Feldmann, FEBS Lett. 450:27-34, 1999). We have identified a large number of genes whose transcription is influenced by Rpn4p.


Figures

FIG. 1
FIG. 1
Reproducibility of mRNA profiling by GeneChip analysis. Hybridization intensities for transcripts from three untreated log-phase samples and three 0.1% MMS-treated samples. (a) Hybridization intensities for 100 MMS-responsive genes; symbols represent basal transcript intensity, averaged from three untreated cultures, ± standard deviation. Green and red symbols represent values for the three MMS-treated cultures, with green for induced and red for repressed. (b) Intensity of hybridization signals for 693 MMS-responsive genes from three independent untreated cultures versus the average of their intensity values. (c) Intensity of hybridization signals for 693 MMS-responsive genes from three independent MMS-treated cultures versus the average of their intensity values. In panels b and c, red lines represent twofold changes from the average. (d) Average intensity value of the untreated cultures versus the average intensity value for the MMS-treated cultures for the 693 MMS-responsive genes. Red lines represent 2-fold, 5-fold, and 10-fold differences in transcript levels.
FIG. 2
FIG. 2
Expression patterns with different MMS exposures. (a) Cells were exposed to 0.1% MMS for the indicated times. The 969 genes that showed a transcript level change of threefold or higher were grouped by similar patterns of expression using hierarchical clustering and visualized graphically using colors to represent the direction and extent of change. Increases in mRNA expression are represented by shades of green, and decreases are shown by shades of red. (b) Cells were exposed to the indicated MMS dose for 60 min. The expression pattern for 1,863 responsive genes is shown as described above. The results in panels a and b were derived independently using different datasets.
FIG. 3
FIG. 3
Effect of cell cycle on MMS-induced mRNA profiles. (a) Cells were arrested in G1 with α-factor, in S with hydroxyurea, or in G2 with nocodazole or allowed to grow to stationary (stat) phase. Transcript levels in each population were measured with and without 0.1% MMS exposure for 60 minutes. The data were divided into 40 clusters using a K-means algorithm (34). The centroids of the 40 clusters were grouped by hierarchical clustering to group clusters with similar profiles together. These 1,876 genes were responsive by more than 3.0-fold. (b) Hierarchical clustering (10) of transcript changes in MMS-treated log-phase cells, untreated stationary-phase cells (compared to untreated log-phase cells), and MMS-treated stationary-phase cells. Genes with more than a three- fold change in any one condition are shown. Fold changes are presented as described above. Clusters I to X represent cell cycle-specific responsive clusters.
FIG. 4
FIG. 4
Global transcriptional profiles in response to different damaging agents. Log-phase cells were exposed to the indicated agents; exposure was limited to 1 h and resulted in the percent survival (as determined by colony-forming ability) indicated in parentheses. Expression profiles for 2,324 responsive genes were grouped by a K-means clustering algorithm into 30 clusters and are represented by colors as described in the legend to Fig. 2. Six clusters containing members whose transcript levels appear to be responsive to only a particular agent are indicated. Treatments were as follows: 200 μM BCNU, 30-kilorad γ-ray, 5 mM t-BuOOH, 0.1% MMS, 4NQO at 2 (low) or 8 (high) μg/ml, and MNNG 8 at (low) or 27 (high) μg/ml. Clusters I to IV represent DNA-damaging agent-specific clusters.
FIG. 5
FIG. 5
SOMs of transcript levels for 2,610 genes that change by threefold or more across 26 exposure conditions. The 26 exposure conditions are as follows: untreated no. 1, untreated no. 2, untreated no. 3, 30 kilorads of irradiation, G1 arrest, 0.1% MMS for 10 min, stationary-phase growth plus 0.1% MMS for 60 min, stationary-phase growth, G1 phase arrest plus 0.1% MMS for 60 min, 0.1% MMS for 30 min, 0.2% MMS for 60 min, S-phase arrest plus 0.1% MMS for 60 min, G2 phase arrest plus 0.1% MMS for 60 min, 0.1% MMS for 60 min no. 1, 0.1% MMS for 60 min no. 2, 0.05% MMS for 60 min, 0.1% MMS for 60 min no. 3, 5 mM t-BuOOH, 200 μM BCNU, 4NQO at 8 μg/ml, MNNG at 27 μg/ml, MNNG at 6.7 μg/ml, S-phase arrest, 4NQO at 2 μg/ml, G2 arrest, and MMC at 2 μg/ml. (A) A total of 2,610 genes were grouped into 18 clusters as described in the text, and the average expression profile for the genes in each cluster is represented; the number of genes in each cluster is indicated. The cluster containing the MAG1 gene is highlighted. The 18 clusters are numbered left to right and top to bottom. (B) Data from SOMs are converted to color representation as described in the legend to Fig. 3, and fold changes are compared to the average transcript levels in three untreated cultures. Lane labels indicate cell cycle phase (G1, G2, S, or stationary [STAT]), agent, concentration, and time (in minutes). The treatments are clustered based on hierarchical methods to group treatments that produce similar profiles together, and their correlation is represented by the dendogram. (C) Distribution of genes containing a MAG1 URS2-like element among the 18 clusters.
FIG. 5
FIG. 5
SOMs of transcript levels for 2,610 genes that change by threefold or more across 26 exposure conditions. The 26 exposure conditions are as follows: untreated no. 1, untreated no. 2, untreated no. 3, 30 kilorads of irradiation, G1 arrest, 0.1% MMS for 10 min, stationary-phase growth plus 0.1% MMS for 60 min, stationary-phase growth, G1 phase arrest plus 0.1% MMS for 60 min, 0.1% MMS for 30 min, 0.2% MMS for 60 min, S-phase arrest plus 0.1% MMS for 60 min, G2 phase arrest plus 0.1% MMS for 60 min, 0.1% MMS for 60 min no. 1, 0.1% MMS for 60 min no. 2, 0.05% MMS for 60 min, 0.1% MMS for 60 min no. 3, 5 mM t-BuOOH, 200 μM BCNU, 4NQO at 8 μg/ml, MNNG at 27 μg/ml, MNNG at 6.7 μg/ml, S-phase arrest, 4NQO at 2 μg/ml, G2 arrest, and MMC at 2 μg/ml. (A) A total of 2,610 genes were grouped into 18 clusters as described in the text, and the average expression profile for the genes in each cluster is represented; the number of genes in each cluster is indicated. The cluster containing the MAG1 gene is highlighted. The 18 clusters are numbered left to right and top to bottom. (B) Data from SOMs are converted to color representation as described in the legend to Fig. 3, and fold changes are compared to the average transcript levels in three untreated cultures. Lane labels indicate cell cycle phase (G1, G2, S, or stationary [STAT]), agent, concentration, and time (in minutes). The treatments are clustered based on hierarchical methods to group treatments that produce similar profiles together, and their correlation is represented by the dendogram. (C) Distribution of genes containing a MAG1 URS2-like element among the 18 clusters.
FIG. 6
FIG. 6
Characterization of an rpn4 deletion strain. (a) Northern analysis of wild-type (WT) and Δrpn4 cells treated with 0.1% MMS for the indicated times. Blots were probed for expression with MAG1-, RAD23-, PRE2-, RNR3-, and SNZ1-derived probes. (b) Colony-forming ability of wild-type, Δmag1, and Δrpn4 cells was measured after 1 h of exposure to 0.1, 0.2 and or 0.3% MMS. (c) SOM clustering of transcript changes in a Δrpn4 deletion strain versus wild (WT), in wild-type cells treated with 0.1% MMS, and in Δrpn4 cells treated with. 0.1% MMS. (d) Relative transcript levels of the 44 genes containing a MAG1 URS2-like sequence in wild-type (WT) and Δrpn4 cells with and without 0.1% MMS for 1 h. Black lines show 21 genes from cluster 3, blue lines show 12 genes from cluster 6, and orange lines show 11 genes from other clusters.

References

    1. Ball C A, Dolinski K, Dwight S S, Harris M A, Issel-Tarver L, Kasarskis A, Scafe C R, Sherlock G, Binkley G, Jin H, Kaloper M, Orr S D, Schroeder M, Weng S, Zhu Y, Botstein D, Cherry J M. Integrating functional genomic information into the Saccharomyces genome database. Nucleic Acids Res. 2000;28:77–80. - PMC - PubMed
    1. Chen J, Derfler B, Samson L. Saccharomyces cerevisiae 3-methyladenine DNA glycosylase has homology to the AlkA glycosylase of E. coli and is induced in response to DNA alkylation damage. EMBO J. 1990;9:4569–4575. - PMC - PubMed
    1. Chen J, Samson L. Induction of S. cerevisiae MAG 3-methyladenine DNA glycosylase transcript levels in response to DNA damage. Nucleic Acids Res. 1991;19:6427–6432. - PMC - PubMed
    1. Cho R J, Campbell M J, Winzeler E A, Steinmetz L, Conway A, Wodicka L, Wolfsberg T G, Gabrielian A E, Landsman D, Lockhart D J, Davis R W. A genome-wide transcriptional analysis of the mitotic cell cycle. Mol Cell. 1998;2:65–73. - PubMed
    1. Chu S, DeRisi J, Elsen M, Mulholland J, Botstein D, Brown P O, Herskowitz I. The transcriptional program of sporulation in budding yeast. Science. 1998;282:699–705. - PubMed

Publication types

MeSH terms