. 2000 Oct 24;97(22):12182-6.
doi: 10.1073/pnas.220392197.

Discovering functional relationships between RNA expression and chemotherapeutic susceptibility using relevance networks

Affiliations

Discovering functional relationships between RNA expression and chemotherapeutic susceptibility using relevance networks

A J Butte et al. Proc Natl Acad Sci U S A. .

Abstract

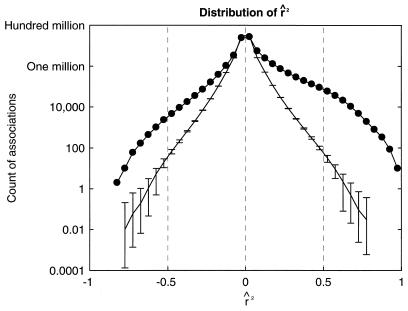
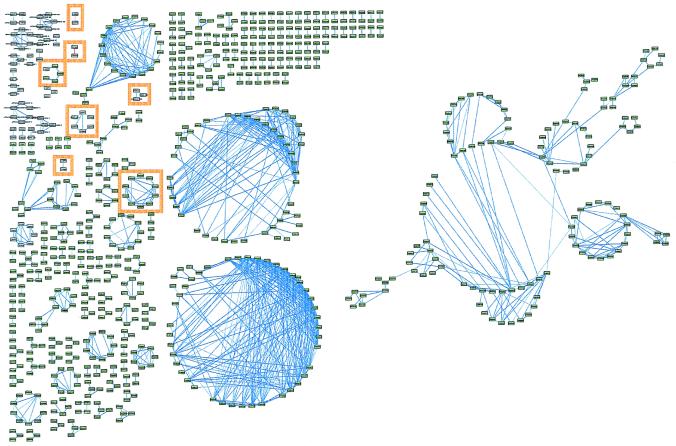
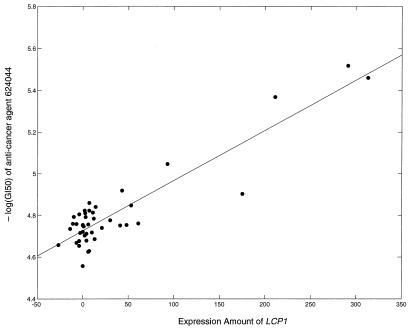
In an effort to find gene regulatory networks and clusters of genes that affect cancer susceptibility to anticancer agents, we joined a database with baseline expression levels of 7,245 genes measured by using microarrays in 60 cancer cell lines, to a database with the amounts of 5,084 anticancer agents needed to inhibit growth of those same cell lines. Comprehensive pair-wise correlations were calculated between gene expression and measures of agent susceptibility. Associations weaker than a threshold strength were removed, leaving networks of highly correlated genes and agents called relevance networks. Hypotheses for potential single-gene determinants of anticancer agent susceptibility were constructed. The effect of random chance in the large number of calculations performed was empirically determined by repeated random permutation testing; only associations stronger than those seen in multiply permuted data were used in clustering. We discuss the advantages of this methodology over alternative approaches, such as phylogenetic-type tree clustering and self-organizing maps.


Figures

Figure 1
Figure 1
A database of baseline expressed levels of 7,245 genes in 60 cancer cell lines was joined with a database containing the amounts of 5,084 anticancer agents needed to inhibit growth of those same cell lines. The joined database contained 12,329 features measured in 60 cell lines. The 637 features that did not contain a sufficient range of values were removed, using an entropy-based method described in the text. The remaining 11,692 features were compared against each other in a pairwise manner making 68,345,586 pairs, in an effort to find anticancer agent susceptibility patterns and gene expression patterns that were correlated with each other. The distribution of correlation coefficients is shown here (2 signifies r2 retaining the sign, positive or negative, of r). For each feature, gene and susceptibility measurements were randomly permuted 100 times. The average distribution of 2 for each permuted set is shown with error bars covering two standard deviations. Random permutation was unable to create an association with 2 at or over 0.80 or lower than −0.85.
Figure 2
Figure 2
Relevance networks constructed from the joined databases of baseline gene expression in 60 cancer cell lines and measures of susceptibility of the same cell lines to anticancer agents. The pairs of features (anticancer agents in green boxes, genes in white boxes) with 2 at or greater than ± 0.80 were drawn with line thickness proportional to 2. Features without an association at ± 0.80 were removed. Associations with negative 2 are in red. Seven networks are highlighted in orange and are in Table 1. Large versions of all figures and descriptions for each accession number may be found at http://www.chip.org/genomics.
Figure 3
Figure 3
The highest 2 between a baseline gene expression and measure of anticancer agent susceptibility was between lymphocyte cytosolic protein-1 (LCP1) and anticancer agent NSC 624044, a thiazolidine carboxylic acid derivative. Here, amount of LCP1 expression is plotted against the GI50 of the anticancer agent across the NCI60 cell lines. Line represents fitted linear model with 2 of 0.83.

References

    1. DeRisi J, Penland L, Brown P O, Bittner M L, Meltzer P S, Ray M, Chen Y, Su Y A, Trent J M. Nat Genet. 1996;14:457–460. - PubMed
    1. Heller R A, Schena M, Chai A, Shalon D, Bedilion T, Gilmore J, Woolley D E, Davis R W. Proc Natl Acad Sci USA. 1997;94:2150–2155. - PMC - PubMed
    1. Michaels G S, Carr D B, Askenazi M, Fuhrman S, Wen X, Somogyi R. Pac. Symp. Biocomput. 1998. 42–53. - PubMed
    1. Wen X, Fuhrman S, Michaels G S, Carr D B, Smith S, Barker J L, Somogyi R. Proc Natl Acad Sci USA. 1998;95:334–339. - PMC - PubMed
    1. Tamayo P, Slonim D, Mesirov J, Zhu Q, Kitareewan S, Dmitrovsky E, Lander E S, Golub T R. Proc Natl Acad Sci USA. 1999;96:2907–2912. - PMC - PubMed

Publication types

LinkOut - more resources