

doi: 10.1073/pnas.97.21.11383.
Global mapping of meiotic recombination hotspots and coldspots in the yeast Saccharomyces cerevisiae
Affiliations
- PMID: 11027339
- PMCID: PMC17209
- DOI: 10.1073/pnas.97.21.11383
Item in Clipboard
Global mapping of meiotic recombination hotspots and coldspots in the yeast Saccharomyces cerevisiae
Proc Natl Acad Sci U S A.
.
Abstract
In the yeast Saccharomyces cerevisiae, meiotic recombination is initiated by double-strand DNA breaks (DSBs). Meiotic DSBs occur at relatively high frequencies in some genomic regions (hotspots) and relatively low frequencies in others (coldspots). We used DNA microarrays to estimate variation in the level of nearby meiotic DSBs for all 6,200 yeast genes. Hotspots were nonrandomly associated with regions of high G + C base composition and certain transcriptional profiles. Coldspots were nonrandomly associated with the centromeres and telomeres.
Figures
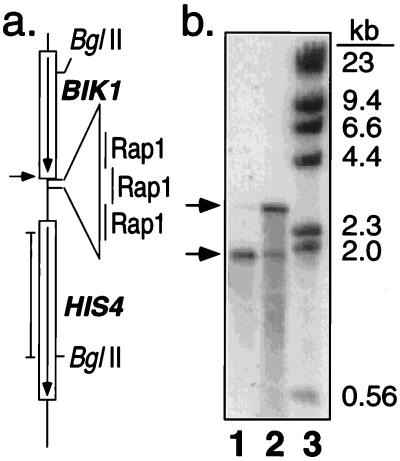
Characterization of DSB-enriched probe. (a) Map of the
HIS4 recombination hotspot in FX4. An insertion of
telomeric DNA with three Rap1 binding sites results in high levels of
meiosis-specific DSBs at the position indicated by the arrow (4). The
position of the probe (pDN42; 4) used in b is shown by
the vertical line adjacent to the map. (b) Southern
analysis of FX4 meiotic DNA samples used in the microarray experiments.
Lanes 1 and 2 contain BglII-treated DSB-enriched DNA
(P2) isolated by using glass fiber filters (11), and
BglII-treated total genomic DNA (P1), respectively. Lane
3 contains HindIII-treated λ DNA. Arrows indicate the
position of the intact 2.9-kb HIS4-BIK1 BglII fragment
and the 1.9-kb fragment resulting from the meiosis-specific DSB.
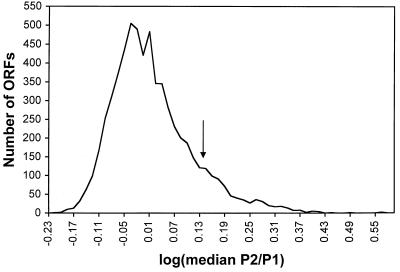
Hotspot activity of yeast ORFs. To estimate DSB formation adjacent to
each ORF, we measured the ratio of hybridization to a DSB-enriched
probe (P2) to a total genomic probe (P1) in seven microarrays. The log
of the median hybridization ratio for each of the 6,200 ORFs is
graphed; ratios were grouped into bins of 0.015 log units. An arrow
marks the separation between the ORFs with hybridization ratios ranked
in the top eighth from those in the bottom seven-eighths.
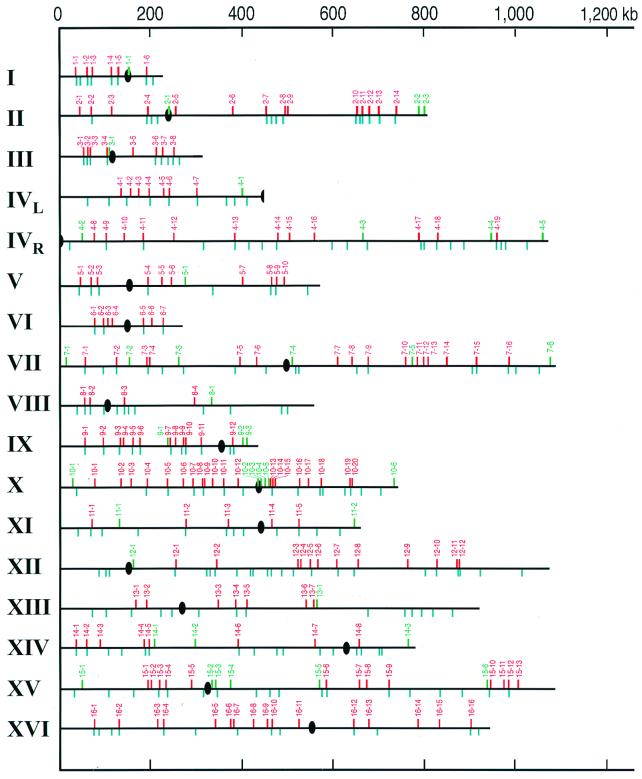
Chromosomal map positions of the hotspots (red) and coldspots (green).
Ovals indicate centromeres. Blue lines represent peaks of G + C base
composition that are 3% higher than the average for the chromosome.
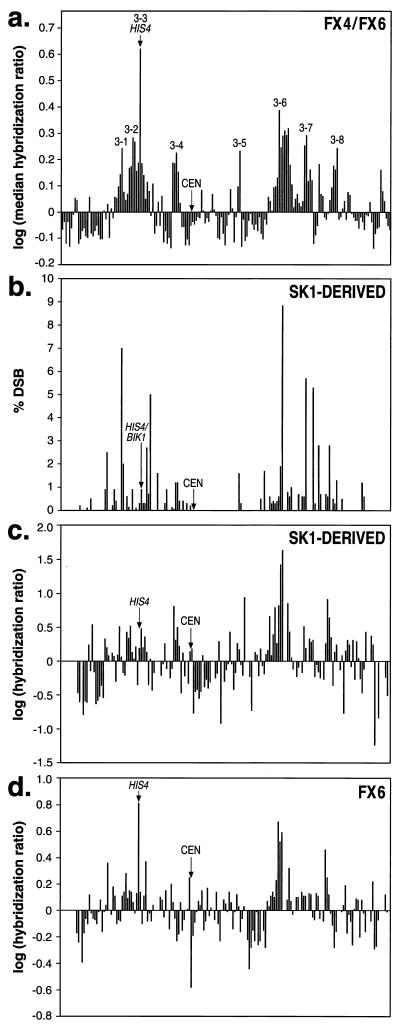
Comparison of different methods of mapping hotspots and coldspots on
chromosome III. (a) Summary of hybridization ratios using
microarrays for all chromosome III ORFs. These data were based on yeast
strains FX4 and FX6, except for the HIS4 locus for which
only the FX6 data were used. Each ORF was assigned the median
hybridization ratio of the seven microarrays and we graphed the log
function of this value. The 182 ORFs represented in the analysis (left
to right on the x axis) are (inclusive Stanford Genome
Database numbering system): YCL076W-YCL073C, YCL069W-YCL016C,
YCL014W-YCL001W, YCR001W-YCR020C, YCR020C-A, YCR021C-YCR024C,
YCR024C-A, YCR025C-YCR029C, YCR029C-A, YCR030C-YCR077C,
YCR079W-YCR097WA, and YCR097WB-YCR107W. The hotspot labels correspond
to those listed in Table 1. (b) Summary of data of
Baudat and Nicolas (13). These researchers monitored DSBs in an SK1
derivative by Southern analysis. (c) Analysis of
hotspots in an SK1 derivative using DNA from immunoprecipitated
Spo11p/hemagglutinin-DNA complexes as a probe of nylon filters
containing chromosome III ORFs. The y axis shows the log
of the average normalized ratio of hybridization (DSB-enriched
probe/total genomic DNA probe). Gaps on the x axis
reflect ORFs that were not present on the nylon filters.
(d) Analysis of hotspots in FX6 using macroarrays. In
this experiment, the probe was prepared by the method used in
a.
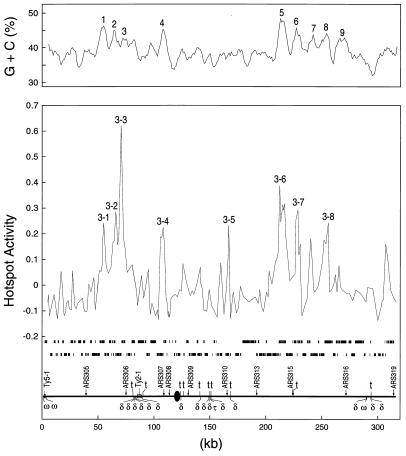
Correlation of hotspots with peaks of high G + C content on chromosome
III. (Upper) A scan of base composition at 1-kb
intervals (5-kb sliding window). The marked peaks have a G + C base
composition ≥ 3% above the average for chromosome III (38.7%).
In addition, we show the log values of the median hybridization ratio
(DSB-enriched probe/total genomic DNA). (Lower) The
ORFs (two lines of black rectangles) and the positions of a number of
structural chromosomal elements are indicated.
References
-
- Lichten M, Goldman A S. Annu Rev Genet. 1995;29:423–444. - PubMed
-
- Petes T D, Malone R E, Symington L S. In: The Molecular and Cellular Biology of the Yeast Saccharomyces. Broach J, Jones E W, Pringle J R, editors. Plainview, NY: Cold Spring Harbor Lab. Press; 1991. pp. 407–521.
-
- Wu T C, Lichten M. Science. 1994;263:515–518. - PubMed
Publication types
MeSH terms
Substances
Grants and funding
LinkOut - more resources
Full Text Sources
Other Literature Sources
Molecular Biology Databases
