

The Finland-United States investigation of non-insulin-dependent diabetes mellitus genetics (FUSION) study. II. An autosomal genome scan for diabetes-related quantitative-trait loci
- PMID: 11032784
- PMCID: PMC1288561
The Finland-United States investigation of non-insulin-dependent diabetes mellitus genetics (FUSION) study. II. An autosomal genome scan for diabetes-related quantitative-trait loci
Abstract
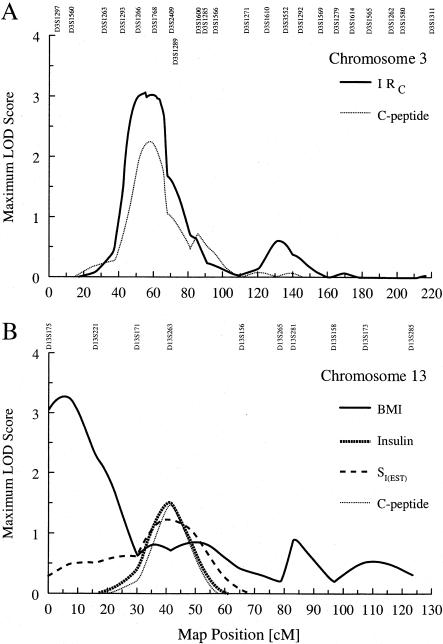
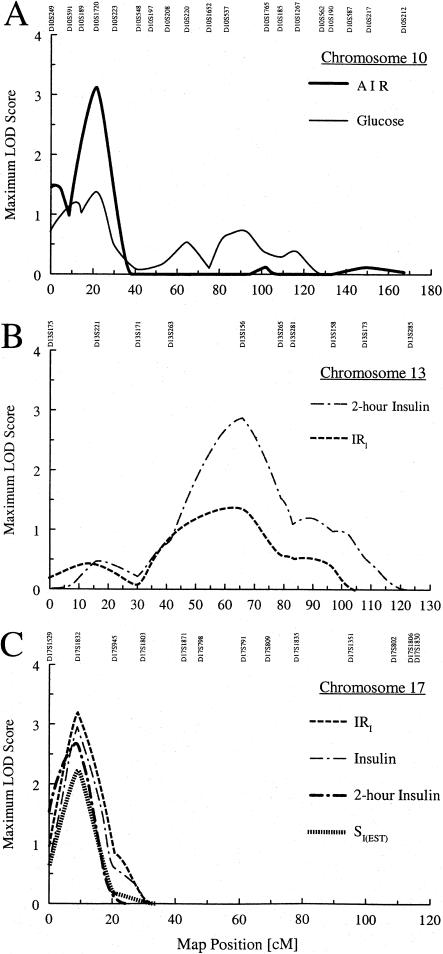
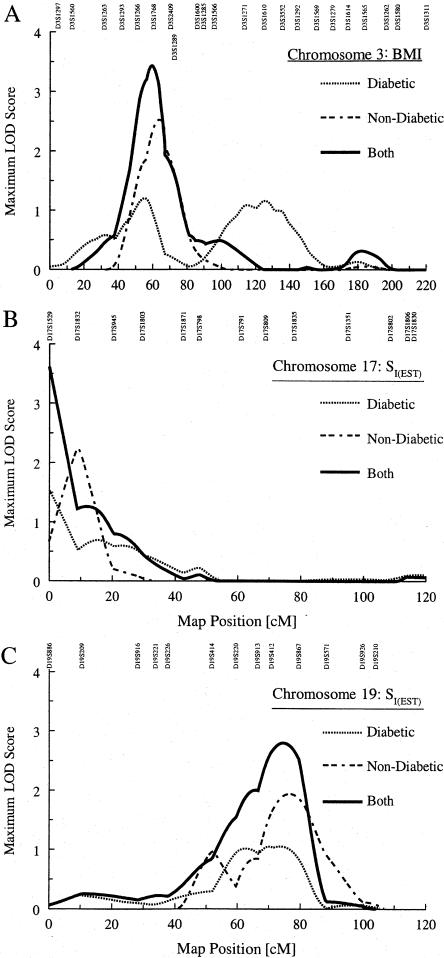
Type 2 diabetes mellitus is a complex disorder encompassing multiple metabolic defects. We report results from an autosomal genome scan for type 2 diabetes-related quantitative traits in 580 Finnish families ascertained for an affected sibling pair and analyzed by the variance components-based quantitative-trait locus (QTL) linkage approach. We analyzed diabetic and nondiabetic subjects separately, because of the possible impact of disease on the traits of interest. In diabetic individuals, our strongest results were observed on chromosomes 3 (fasting C-peptide/glucose: maximum LOD score [MLS] = 3.13 at 53.0 cM) and 13 (body-mass index: MLS = 3.28 at 5.0 cM). In nondiabetic individuals, the strongest results were observed on chromosomes 10 (acute insulin response: MLS = 3.11 at 21.0 cM), 13 (2-h insulin: MLS = 2.86 at 65.5 cM), and 17 (fasting insulin/glucose ratio: MLS = 3.20 at 9.0 cM). In several cases, there was evidence for overlapping signals between diabetic and nondiabetic individuals; therefore we performed joint analyses. In these joint analyses, we observed strong signals for chromosomes 3 (body-mass index: MLS = 3.43 at 59.5 cM), 17 (empirical insulin-resistance index: MLS = 3.61 at 0.0 cM), and 19 (empirical insulin-resistance index: MLS = 2.80 at 74.5 cM). Integrating genome-scan results from the companion article by Ghosh et al., we identify several regions that may harbor susceptibility genes for type 2 diabetes in the Finnish population.
Figures
References
Electronic-Database Information
-
- Online Mendelian Inheritance in Man (OMIM), http://www3.ncbi.nlm.nih.gov/Omim (for PPARG [MIM 601487], SST [MIM 182450], TNF [MIM 191160], GLP1R [MIM 138032], FBP1 [MIM 229700], FBP2 [MIM 603027], CKM [MIM 123310], GIPR [MIM 137241], HNF3G [MIM 602295], GYS1 [MIM 138570], PK1 [MIM 266200], KCNJ9 [MIM 600932], IGFBP1 [MIM 146730], IGFBP3 [MIM 146732], GCK [MIM 138079], PCK2 [MIM 261650], HNF3A [MIM 602294], SLC2A4 [MIM 138190], MAP2K4 [MIM 601335], and ADORA2B [MIM 600446])
References
-
- Auwerx J (1999) PPARgamma, the ultimate thrifty gene. Diabetologia 42:1033–1049 - PubMed
-
- Bach LA, Rechler MM (1992) Insulin-like growth factors and diabetes. Diabetes Metab Rev 8:229–257 - PubMed
-
- Beamer BA, Yen C-J, Andersen RE, Muller D, Elahi D, Cheskin LJ, Andres R, Roth J, Shuldiner AR (1998) Association of the Pro12Ala variant in the peroxisome proliferator-activated receptor-γ2 gene with obesity in two Caucasian populations. Diabetes 47:1806–1808 - PubMed
Publication types
MeSH terms
Substances
Grants and funding
LinkOut - more resources
Full Text Sources
Medical
Molecular Biology Databases
