. 2000 Nov;47(5):675-84.
doi: 10.1136/gut.47.5.675.

Radiation induced cytochrome c release causes loss of rat colonic fluid absorption by damage to crypts and pericryptal myofibroblasts

Affiliations

Radiation induced cytochrome c release causes loss of rat colonic fluid absorption by damage to crypts and pericryptal myofibroblasts

J R Thiagarajah et al. Gut. 2000 Nov.

Abstract

Background: Therapeutic or accidental exposure to radiation commonly causes gastrointestinal disturbances, including diarrhoea. Rats subjected to whole body ionising radiation at a dose of 8 Gy lose their capacity to absorb fluid via the descending colon after four days. After seven days, fluid absorption recovers to control levels.

Aims: To investigate the effect of ionising radiation on colonic permeability together with its effect on mitochondria dependent apoptotic signals and intercellular adhesion molecules.

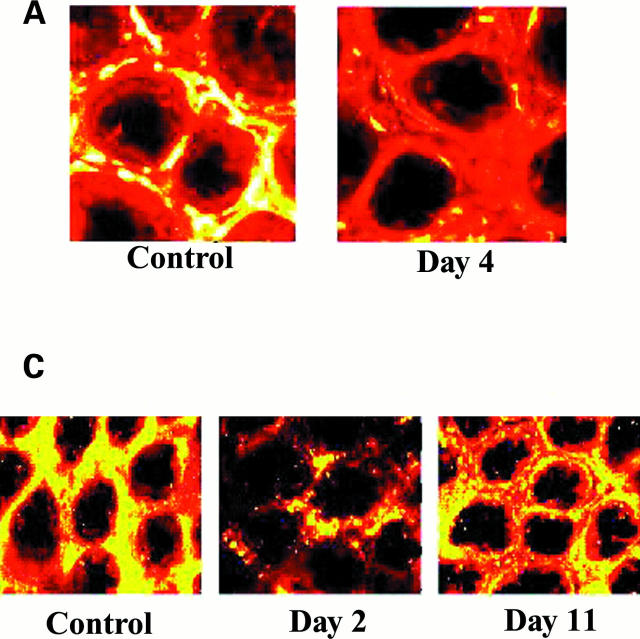
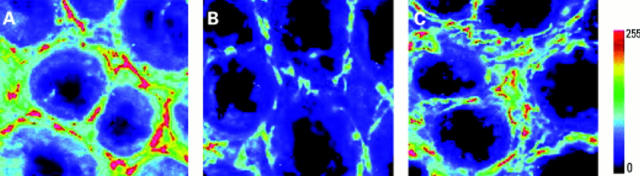
Methods: Rats were irradiated with doses of 0-12 Gy. Colonic permeability was measured by accumulation of fluorescein isothiocyanate (FITC) dextran in crypt lumens. Changes in levels of cytochrome c, caspase 3, E and OB cadherin, beta-catenin smooth muscle actin, and collagen IV were assessed using immunocytochemistry with confocal microscopy.

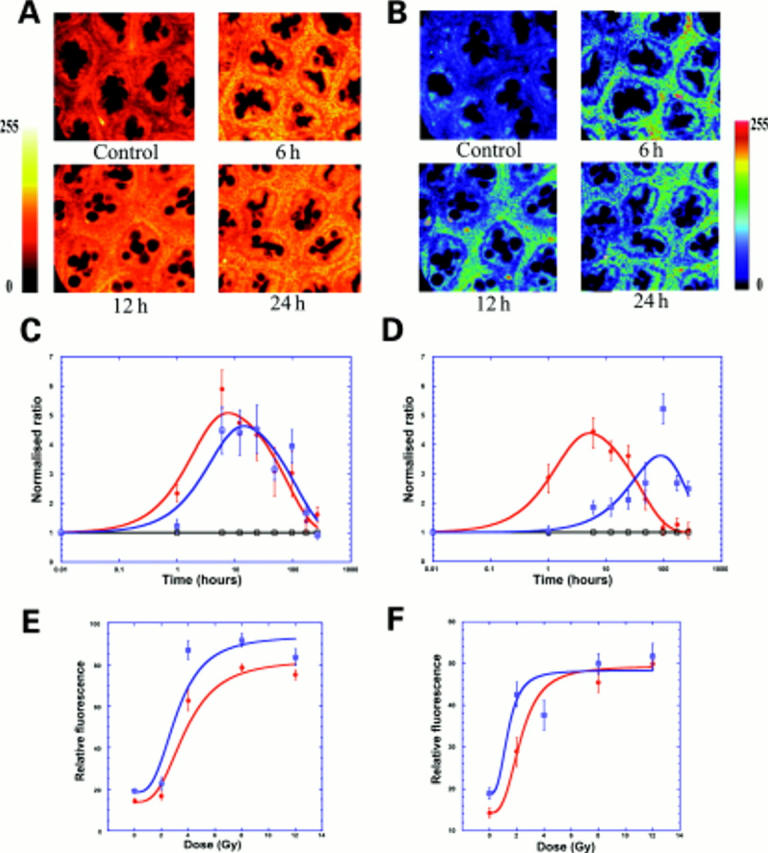
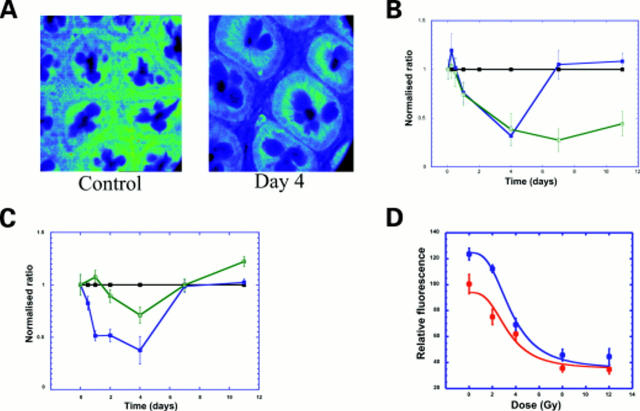
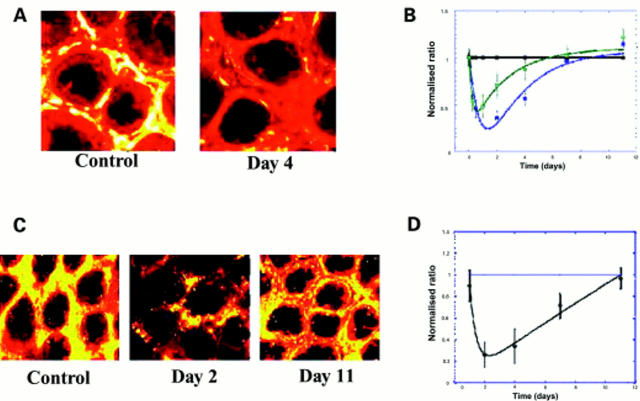
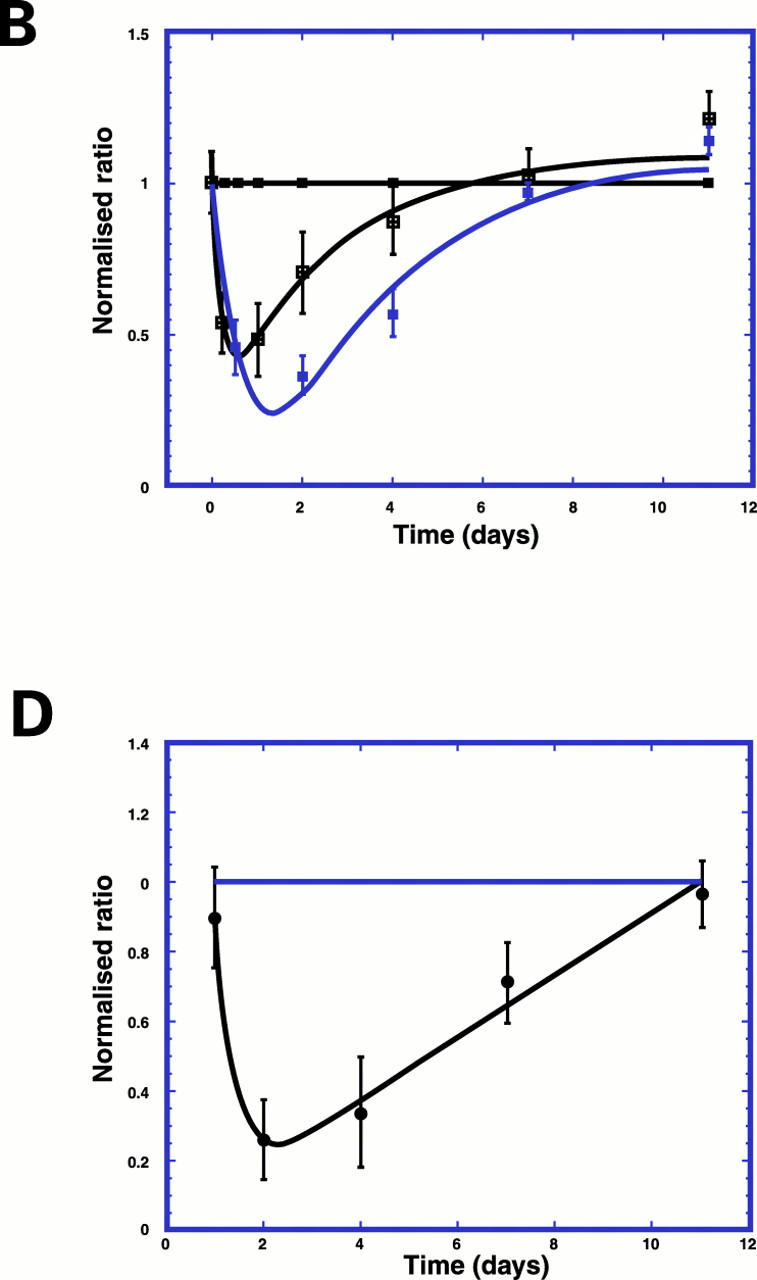
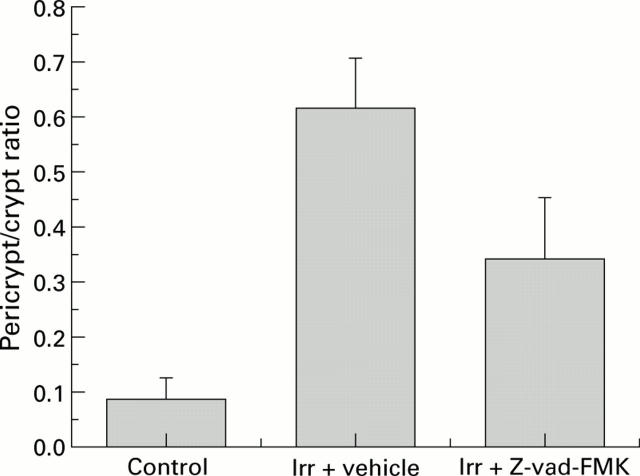
Results: Cytosolic cytochrome c increased after 8 Gy (t(1/2) 1.4 (0.6) hours) and peaked at approximately six hours. Caspase 3 increased more slowly, particularly in crypt epithelial cells (t(1/2) 57 (14.5) hours). Pericryptal myofibroblasts disintegrated within 24 hours as was evident from loss of OB cadherin and smooth muscle actin. This coincided with increased crypt permeability to dextran. Intercellular adhesion between crypt luminal cells was not lost until day 4 when both beta-catenin and E-cadherin were minimal. The half maximal dose-response for these effects was in the range 2-4 Gy. Recovery of colonic transport was concurrent with recovery of pericryptal smooth muscle actin and OB cadherin. The pan caspase inhibitor Z-Val-Ala-Asp.fluoromethylketone (1 mg/kg per day) had a small effect in conserving the pericryptal sheath myofibroblasts and sheath permeability but had no systemic therapeutic effects.

Conclusions: These data suggest that radiation damage to the colon may be initiated by mitochondrial events. Loss of crypt fluid absorption and increased permeability coincided with decreased intercellular adhesion between crypt epithelial cells and loss of pericryptal sheath barrier function.


Figures

Figure 1
Figure 1
Confocal images at a depth of 40 µm from the luminal surface. (A) Control rats accumulate dextran within crypt lumens 10 times above that in external solution. Two (B) and four (C) days after radiation (8 Gy), reduced accumulation in crypt and increased leakage into the pericryptal region are seen. Seven days after irradiation (D) some recovery with increased accumulation in crypt lumens is evident.
Figure 2
Figure 2
Rapid release of cytochrome c after radiation in both crypt and pericrypt regions and appearance of caspase 3. (A) Confocal images (depth 20 µm) showing cytochrome c after 8 Gy radiation in rat colon in controls and after six, 12, and 24 hours. (B) Confocal images (depth 20 µm) showing caspase 3 after 8 Gy radiation in rat colon in controls and after six, 12, and 24 hours. (C) Time course of cytochrome c (red) and caspase 3 (blue) in pericryptal sheath after 8 Gy radiation showing a small time lag between maximal increases. Data shown (n=3) as normalised ratios on a log scale against controls taken from the pericryptal region. Cytochrome c data were plotted with a biphasic exponential fit giving half times for the increase and decrease (see table 1 and materials and methods). (D) Time course of cytochrome c (red) and caspase 3 (blue) in crypt cells after 8 Gy radiation showing a large time lag between maximal increases. Data from crypt regions of same images used for (C). (E) Dose-response (0-12 Gy) curve for cytochrome c release after 12 hours in pericryptal (red) and crypt (blue) cells. Data shown as relative fluorescence (n=3) plotted with a non-linear Michaelis-Menten curve fit showing a saturable dose-response. (F) Dose-response (0-12 Gy) curve for caspase 3 after 12 hours in pericryptal (red) and crypt (blue) cells. Data shown as relative fluorescence (n=3) plotted with a non-linear Michaelis-Menten curve fit showing a saturable dose-response.
Figure 3
Figure 3
Decrease in E-cadherin and β-catenin in colon 2-4 days after radiation. (A) Confocal images (depth 20 µm) showing decrease in E-cadherin four days after radiation, particularly in the pericryptal region. (B) Time course of E-cadherin in pericryptal (blue) and crypt (green) cells after 8 Gy radiation showing a decrease in both the pericrypt and crypt and recovery in pericryptal cells. Data shown (n=3) as normalised ratios against control. (C) Time course of β-catenin in pericryptal (blue) and crypt (green) cells after 8 Gy radiation showing a decrease in both the pericrypt and crypt and recovery in both pericryptal and crypt cells. Data shown (n=3) as normalised ratios against control. (D) Dose-response of E-cadherin (0-12 Gy) showing a saturable decrease. Data shown as relative fluorescence (n=3) and plotted using a non-linear Michaelis-Menten fit.
Figure 4
Figure 4
Decrease in α smooth muscle actin, OB cadherin, and collagen type IV in pericryptal sheath region after radiation. (A) Confocal images (depth 20 µm) showing decrease in smooth muscle actin in pericryptal areas after 8 Gy radiation. (B) Time course of smooth muscle actin (blue) and OB cadherin (green) in pericryptal sheath cells after 8 Gy radiation showing maximal decreases at two days and recovery after seven days. Data shown (n=3) as normalised ratios against control. (C) Confocal images (depth 20 µm) showing decrease in collagen type IV in pericryptal areas after 8 Gy radiation. (D) Time course of collagen type IV in pericryptal sheath after 8 Gy radiation showing maximal decreases at 2-4 days and recovery after 11 days. Data shown (n=3) as normalised ratios against control.
Figure 4
Figure 4
Decrease in α smooth muscle actin, OB cadherin, and collagen type IV in pericryptal sheath region after radiation. (A) Confocal images (depth 20 µm) showing decrease in smooth muscle actin in pericryptal areas after 8 Gy radiation. (B) Time course of smooth muscle actin (blue) and OB cadherin (green) in pericryptal sheath cells after 8 Gy radiation showing maximal decreases at two days and recovery after seven days. Data shown (n=3) as normalised ratios against control. (C) Confocal images (depth 20 µm) showing decrease in collagen type IV in pericryptal areas after 8 Gy radiation. (D) Time course of collagen type IV in pericryptal sheath after 8 Gy radiation showing maximal decreases at 2-4 days and recovery after 11 days. Data shown (n=3) as normalised ratios against control.
Figure 5
Figure 5
Effect of Z-vad-FMK treatment on α smooth muscle actin in the pericryptal sheath region after radiation. Confocal images (depth 20 µm) showing (A) control, (B) irradiated (8 Gy)+vehicle treated, and (C) irradiated (8 Gy)+Z-vad-FMK treated.
Figure 6
Figure 6
Effect of Z-vad-FMK treatment on FITC dextran accumulation after radiation. Ratio of pericrypt to crypt fluorescence in control, irradiated (irr) (8 Gy)+vehicle treated, and irradiated (8 Gy)+Z-vad-FMK treated.
Figure 7
Figure 7
Summary diagram showing possible pathway after radiation in the colon and relationship to functional changes.

References

    1. FEBS Lett. 1999 Dec 3;462(3):295-301 - PubMed
    1. Cell Death Differ. 1999 Nov;6(11):1117-24 - PubMed
    1. J Physiol. 1999 Jan 1;514 ( Pt 1):211-27 - PubMed
    1. Radiat Res. 1999 Apr;151(4):468-78 - PubMed
    1. J Clin Invest. 1999 Apr;103(7):971-8 - PubMed

MeSH terms