. 2000 Nov;47(5):685-8.
doi: 10.1136/gut.47.5.685.

Stimulation of colorectal cancer cell line growth by ET-1 and its inhibition by ET(A) antagonists

Affiliations

Stimulation of colorectal cancer cell line growth by ET-1 and its inhibition by ET(A) antagonists

H Ali et al. Gut. 2000 Nov.

Abstract

Background: The vasoactive peptide endothelin 1 (ET-1) acts via two receptors, endothelin receptors A (ET(A)) and B (ET(B)). ET-1 is overexpressed by human cancers in vivo and in vitro and may be mitogenic for cancer cells.

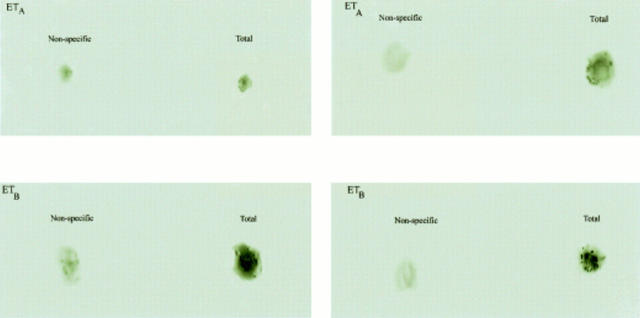
Method: To elucidate if ET-1 is a growth regulator the following were investigated in human colorectal cancer cell lines (LIM1215 and HT29): ET-1 production by ELISA; ET receptor expression using radioligand autoradiographic techniques; and responsiveness to ET-1, and to ET(A) and ET(B) antagonism by growth measurements.

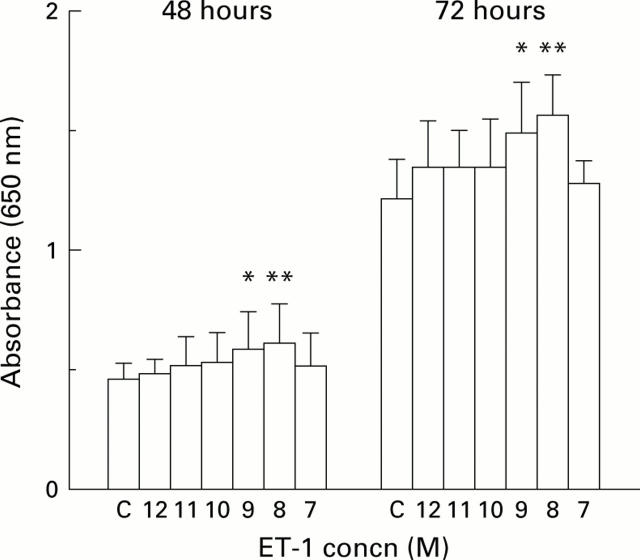
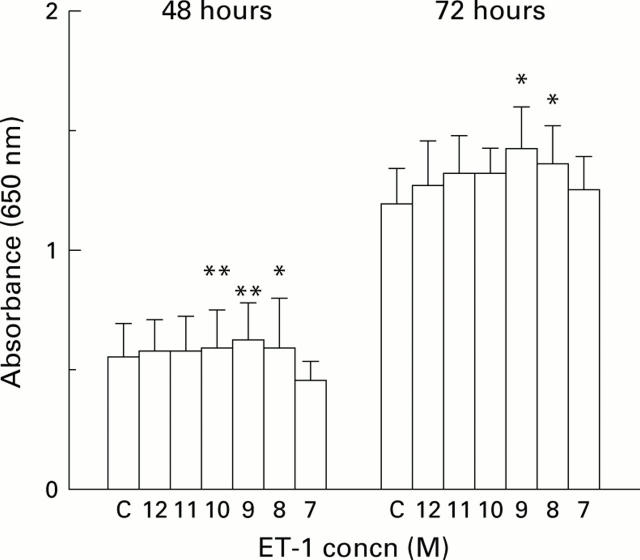
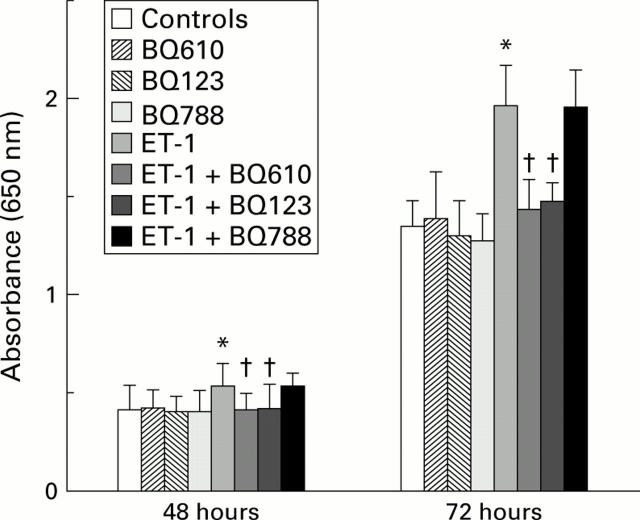
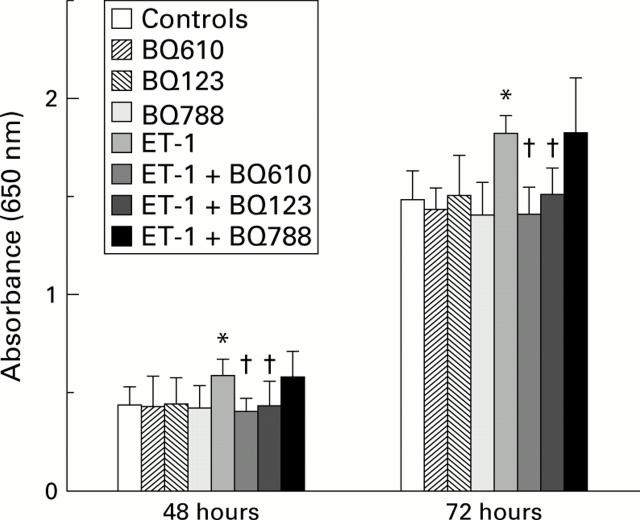
Results: ET-1 was produced by LIM1215 and HT29 cells (21.3 and 41.7 fmol/ml/10(6) cells (24 hours); 22.6 and 71.7 fmol/ml/10(6) cells (48 hours), respectively). ET(A) and ET(B) receptors were expressed by both cell lines. Addition of ET-1 resulted in a dose dependent increase in cell numbers which was significant at 10(-8)-10(-9) M for LIM1215, with the greatest increase at 10(-8) M (32.7% and 28.4% increase above controls at 48 hours and 72 hours; p<0.05) and at 10(-8)-10(-9) M for HT29, with the greatest increase at 10(-9) M (13.4% and 15.7% increase above controls at 48 hours and 72 hours; p<0.05). ET(A) antagonists BQ123 and BQ610, but not the ET(B) antagonist BQ788, inhibited ET-1 induced proliferation of both LIM1215 and HT29 (p<0.05).

Conclusion: ET-1 can stimulate the proliferation of colorectal cancer cell lines via the ET(A), but not the ET(B), receptor.


Figures

Figure 1
Figure 1
Binding for endothelin receptors (ETA and ETB) on LIM1215 (left) and HT29 (right) cell cytospins was demonstrated by autoradiography. Slides were incubated with ETA antagonist (125I PD151242) or ETB agonist (125I BQ3020) for total binding. Non-specific binding was determined by incubation with excess unlabelled ligand. Total binding was clearly in excess of non-specific binding, suggesting the presence of both receptors in these cell types.
Figure 2
Figure 2
Effect of addition of endothelin 1 (ET-1) on LIM1215 cell growth. Cells were grown for 48 or 72 hours in the presence of increasing concentrations of ET-1 (10−12 M to 10−7 M; shown on the x axis as 12 to 7). Cell growth was measured using the methylene blue assay and read as absorbance (equivalent to cell numbers) at 650 nm. Results are shown as mean (SD). Statistically significant growth is shown as *p<0.05 or **p<0.01 (Student's paired t test). C, control.
Figure 3
Figure 3
Effect of addition of endothelin 1 (ET-1) on HT29 cell growth. Cells were grown for 48 or 72 hours in the presence of increasing concentrations of ET-1 (10−12 M to 10−7 M, shown on the x axis as 12 to 7). Cell growth was measured using the methylene blue assay and read as absorbance (equivalent to cell numbers) at 650 nm. Results are shown as mean (SD). Statistically significant cell growth is shown as *p<0.05 or **p<0.01 (Student's paired t test). C, control.
Figure 4
Figure 4
Effect of endothelin 1 (ET-1) and/or endothelin receptor antagonists on LIM1215 cell growth. Cells were grown for 48 or 72 hours in the presence of 10−8 M ET-1 and/or ETA receptor antagonist BQ123 or BQ610, or ETB receptor antagonist BQ788, all at 100 nM. Cell growth was measured using the methylene blue assay and read as absorbance (equivalent to cell numbers) at 650 nm. Results are shown as mean (SD). Cell numbers were significantly higher in the ET-1 group compared with control cells (*p<0.05, Student's t test); cell numbers from groups treated with both ET-1 and ETA antagonists were similar to control levels, and were significantly lower than in the ET-1 group (†p<0.05, Student's t test).
Figure 5
Figure 5
Effect of endothelin 1 (ET-1) and/or endothelin receptor antagonists on HT29 cell growth. Cells were grown for 48 or 72 hours in the presence of 10−9 M ET-1 and/or ETA receptor antagonist BQ123 or BQ610, or ETB receptor antagonist BQ788, all at 100 nM. Cell growth was measured using the methylene blue assay and read as absorbance (equivalent to cell numbers) at 650 nm. Results are shown as mean (SD). Cell numbers were significantly higher in the ET-1 group compared with control cells (*p<0.05, Student's t-test); cell numbers from groups treated with both ET-1 and ETA antagonists were similar to control levels, and were significantly lower than in the ET-1 group (†p<0.05, Student's t test).

Similar articles

Cited by

References

    1. Nature. 1988 Mar 31;332(6163):411-5 - PubMed
    1. Curr Opin Cell Biol. 1999 Apr;11(2):184-9 - PubMed
    1. Biochem Biophys Res Commun. 1989 Feb 15;158(3):880-3 - PubMed
    1. Proc Natl Acad Sci U S A. 1989 Apr;86(8):2863-7 - PubMed
    1. Jpn J Cancer Res. 1989 Apr;80(4):302-5 - PubMed

MeSH terms