. 2000 Oct 15;528 Pt 2(Pt 2):317-26.
doi: 10.1111/j.1469-7793.2000.00317.x.

Real-time studies of zymogen granule exocytosis in intact rat pancreatic acinar cells

Affiliations

Real-time studies of zymogen granule exocytosis in intact rat pancreatic acinar cells

M Campos-Toimil et al. J Physiol. .

Abstract

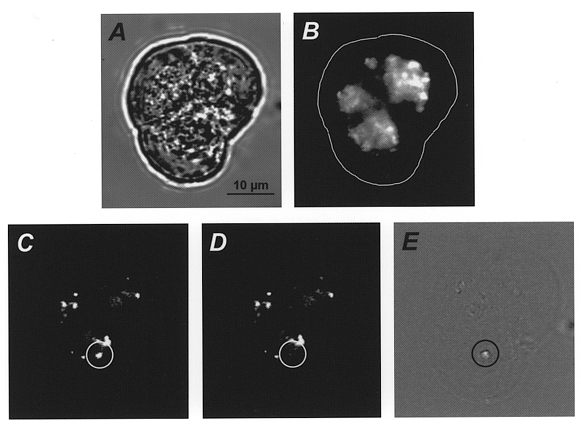
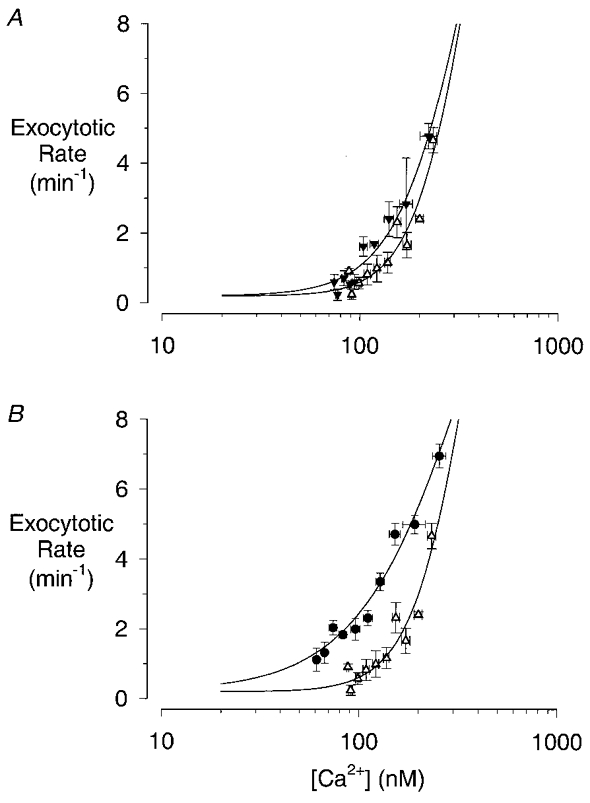
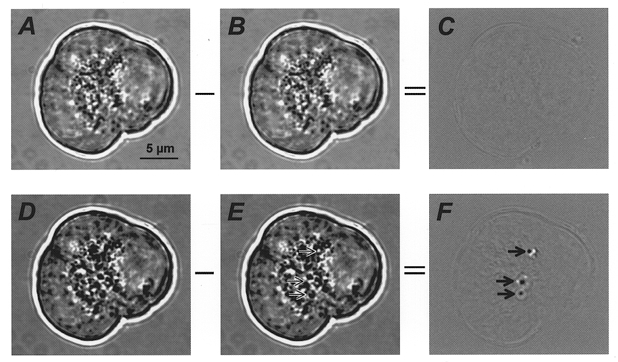
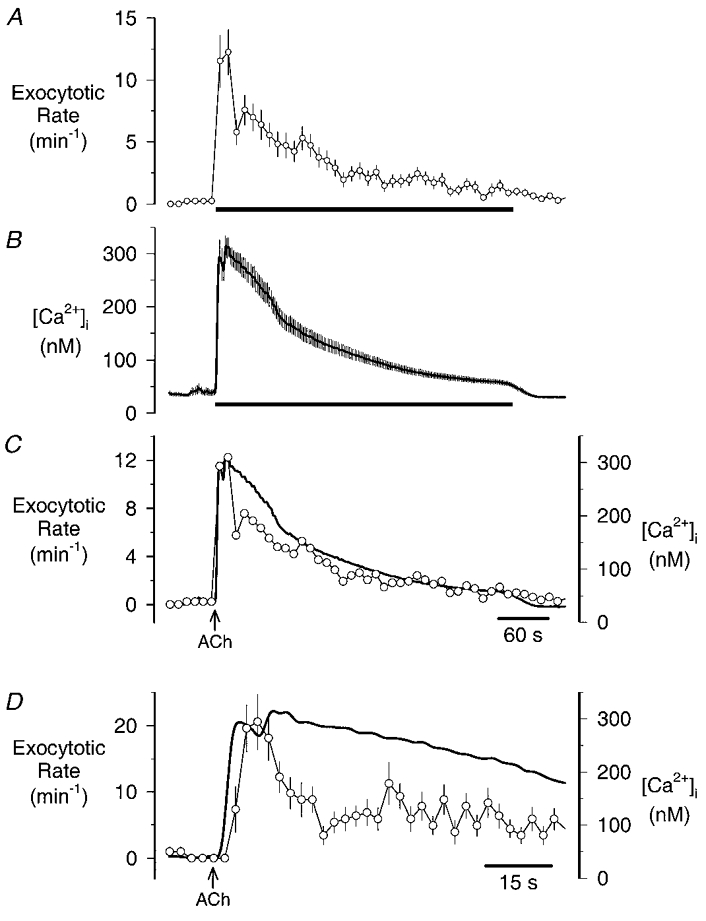
An adequate understanding of secretion requires the measurement of exocytosis on the same time scale as that used for second messenger dynamics. To investigate the kinetics of ACh-evoked secretion in pancreatic acinar cells, exocytosis of zymogen granules was quantified by continuous, time-differential analysis of digital images. The validity of this method was confirmed by simultaneous fluorescence imaging of quinacrine-loaded zymogen granules. Basal rates of exocytosis were low (0.2 events min(-1)). ACh stimulated a biphasic increase in secretory activity, maximal rates exceeding 20 events min(-1) after 10 s of ACh application (10 microM). Over the next 15 s the rate of exocytosis fell to less than 4 events min(-1); then began a second phase of secretion that peaked 15 s later at approximately 11 events min(-1), but subsequently declined in the continued presence of agonist. Measurements of fura-2 fluorescence demonstrated a biphasic increase in intracellular [Ca2+] ([Ca2+]i). Comparison of the [Ca2+]i records and time-differential analysis revealed that the fall in exocytotic rate following the initial burst occurred despite the fact that [Ca2+]i remained high. The second phase of secretion depended on both [Ca2+]i and [ACh]. At 10 microM ACh there was a decrease in the steepness of the relationship between [Ca2+]i and exocytosis that led to an enhancement of the slow secretory phase. We propose that acinar cells contain two pools of secretory vesicles: a small pool of granules that is exocytosed rapidly, but is quickly depleted; and a reserve pool of granules that can be recruited by ACh in a process that is modulated by second messengers other than calcium.


Figures

Figure 2
Figure 2. ACh-evoked loss of quinacrine fluorescence
A three-cell acinus loaded with quinacrine before (A and B) and during (C–E) treatment with 10 μm ACh. A, brightfield image at the start of the recording. B, fluorescence image taken at the same time. The continuous white line shows the outline of the acinus made by tracing around the image shown in A. C and D, consecutive fluorescence images captured during application of ACh (note: the image contrast has been adjusted compared with B to allow identification of individual granules, one of which is circled in C). E shows the time-differential image formed by subtraction of the brightfield equivalent of D from the brightfield equivalent of C, exocytosis of a quinacrine-loaded zymogen granule is circled (C-E).
Figure 5
Figure 5. [Ca2+]i dependency of the slow phase of secretion
A, plots of the data in Fig. 4Bvs. the data in Fig. 4A for ACh concentrations of 250 nm (▵) and 1 μm (▾). B, plots of the data in Fig. 4Bvs. the data in Fig. 4A for ACh concentrations of 250 nm (▵) and 10 μm (•). Pairs of data points, between 40 and 340 s after the start of ACh application, were ranked in order of [Ca2+] and then divided into bins of three samples each; points represent the mean ±s.e.m. (vertical error bars) or ±s.d. (horizontal error bars). The continuous lines are least-squares fits to eqn (1) with m= 0.2 min−1; a= 19.8 min−1; b= 2.95 (250 nm) or 2.36 (1 μm) or 1.52 (10 μm), and k= 371 nm (250 nm) or 370 nm (1 μm) or 393 nm (10 μm); r2= 0.90 (250 nm), 0.95 (1 μm) and 0.97 (10 μm).
Figure 1
Figure 1. Continuous, time-differential analysis of ACh-evoked changes in acinar cell morphology
Brightfield images of an acinus consisting of three cells are shown before (A and B) and during (D and E) treatment with 10 μm ACh. Subtraction of one frame from its predecessor (AB or DE) creates a time-differential image (C or F, respectively). Three exocytotic events are clearly visible in F (arrows); arrows in E indicate the regions where these exocytotic events occurred.
Figure 3
Figure 3. Time course of ACh-stimulated changes in [Ca2+]i and zymogen granule exocytosis
A, changes in the rate of exocytosis (measured every 1.25 s and analysed in 10 s bins) evoked by a 6 min application (horizontal bar) of 10 μm ACh; points represent the mean ±s.e.m. determined in 50 cells. B, changes in [Ca2+]i elicited by a 6 min application (horizontal bar) of 10 μm ACh; points represent the mean ±s.e.m. determined in 19 cells. C, traces from A and B superimposed (thick continuous trace, [Ca2+]i; ○, exocytosis), error bars omitted for clarity. D, as in C except the rate of exocytosis is analysed in 2.5 s bins and error bars are shown. Arrows in C and D indicate the start of the ACh application.
Figure 4
Figure 4. ACh dose dependency of [Ca2+]i and exocytosis in acinar cells
A, changes in [Ca2+]i in acinar cells treated with various concentrations of ACh for 6 min: 10 nm, n= 19; 50 nm, n= 27; 250 nm, n= 17; 1 μm, n= 26; and 10 μm, n= 19. B, changes in the rate of exocytosis in acinar cells treated with various concentrations of ACh for 6 min: 10 nm, n= 8; 50 nm, n= 22; 250 nm, n= 24; 1 μm, n= 33; and 10 μm, n= 50. C, cumulative secretory response (i.e. the time integral of the exocytotic responses shown in B). The period of ACh application is indicated by the horizontal bars in A and B. The arrow in C indicates the start of ACh application.

Similar articles

Cited by

References

    1. Agard DA, Hiraoka Y, Shaw P, Sedat JW. Fluorescence microscopy in three dimensions. Methods in Cell Biology. 1989;30:353–377. - PubMed
    1. Aughsteen AA, Kataoka K, Shair SA. Correlative morphometric and biochemical study on pancreatic amylase in normal and streptozotocin-diabetic rats. Pancreas. 1996;13:295–303. - PubMed
    1. Augustine GJ, Neher E. Calcium requirements for secretion in bovine chromaffin cells. The Journal of Physiology. 1992;450:247–271. - PMC - PubMed
    1. Betz W, Mao F, Smith CB. Imaging exocytosis and endocytosis. Current Opinion in Neurobiology. 1996;6:365–371. - PubMed
    1. Betz WJ, Bewick GS. Optical analysis of synaptic vesicle recycling at the frog neuromuscular junction. Science. 1992;255:200–203. - PubMed

Publication types

LinkOut - more resources