

Necrosis of lung epithelial cells during infection with Mycobacterium tuberculosis is preceded by cell permeation
- PMID: 11035739
- PMCID: PMC97713
- DOI: 10.1128/IAI.68.11.6300-6310.2000
Necrosis of lung epithelial cells during infection with Mycobacterium tuberculosis is preceded by cell permeation
Abstract
Mycobacterium tuberculosis establishes infection, progresses towards disease, and is transmitted from the alveolus of the lung. However, the role of the alveolar epithelium in any of these pathogenic processes of tuberculosis is unclear. In this study, lung epithelial cells (A549) were used as a model in which to examine cytotoxicity during infection with either virulent or avirulent mycobacteria in order to further establish the role of the lung epithelium during tuberculosis. Infection of A549 cells with M. tuberculosis strains Erdman and CDC1551 demonstrated significant cell monolayer clearing, whereas infection with either Mycobacterium bovis BCG or Mycobacterium smegmatis LR222 did not. Clearing of M. tuberculosis-infected A549 cells correlated to necrosis, not apoptosis. Treatment of M. tuberculosis-infected A549 cells with streptomycin, but not cycloheximide, demonstrated a significant reduction in the necrosis of A549 cell monolayers. This mycobacterium-induced A549 necrosis did not correlate to higher levels of intracellular or extracellular growth by the mycobacteria during infection. Staining of infected cells with propidium iodide demonstrated that M. tuberculosis induced increased permeation of A549 cell membranes within 24 h postinfection. Quantitation of lactate dehydrogenase (LDH) release from infected cells further demonstrated that cell permeation was specific to M. tuberculosis infection and correlated to A549 cellular necrosis. Inactivated M. tuberculosis or its subcellular fractions did not result in A549 necrosis or LDH release. These studies demonstrate that lung epithelial cell cytotoxicity is specific to infection by virulent mycobacteria and is caused by cellular necrosis. This necrosis is not a direct correlate of mycobacterial growth or of the expression of host cell factors, but is preceded by permeation of the A549 cell membrane and requires infection with live bacilli.
Figures
 , 1%
digitonin-treated cells. Data shown are means from two experiments run
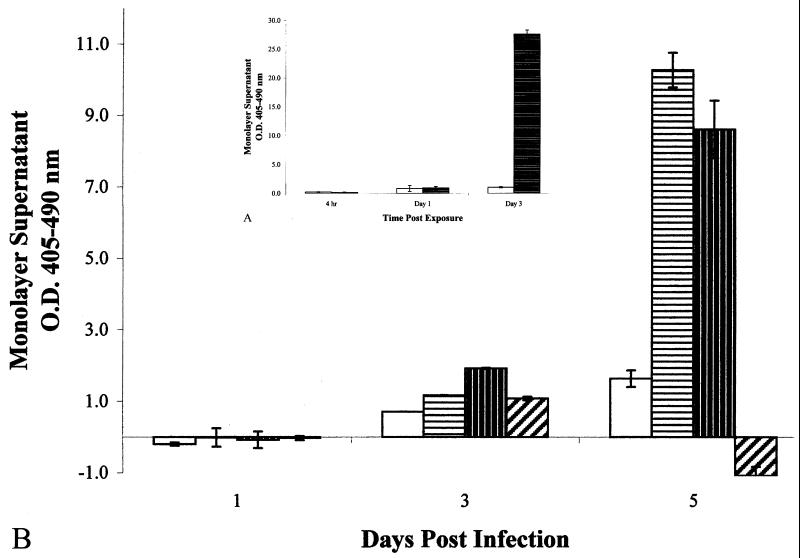
in triplicate. Error bars, standard deviations. (B) Optical densities
of histone-DNA complexes released in the culture supernatants of
infected epithelial cell monolayers. All monolayers were infected at an
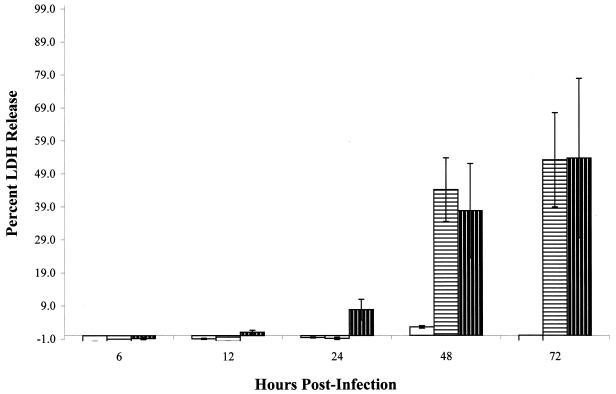
MOI of 10:1. □, M. bovis BCG;
, 1%
digitonin-treated cells. Data shown are means from two experiments run
in triplicate. Error bars, standard deviations. (B) Optical densities
of histone-DNA complexes released in the culture supernatants of
infected epithelial cell monolayers. All monolayers were infected at an
MOI of 10:1. □, M. bovis BCG;
 , M. tuberculosis
strain Erdman;
, M. tuberculosis
strain Erdman;  , M.
tuberculosis strain CDC1551;
, M.
tuberculosis strain CDC1551;
 , M. smegmatis. Data
shown are means from three different experiments of triplicate
monolayers. Error bars, standard errors. The values obtained were
normalized by subtraction of background levels of necrosis of
uninfected A549 cell monolayers at each time point.
, M. smegmatis. Data
shown are means from three different experiments of triplicate
monolayers. Error bars, standard errors. The values obtained were
normalized by subtraction of background levels of necrosis of
uninfected A549 cell monolayers at each time point.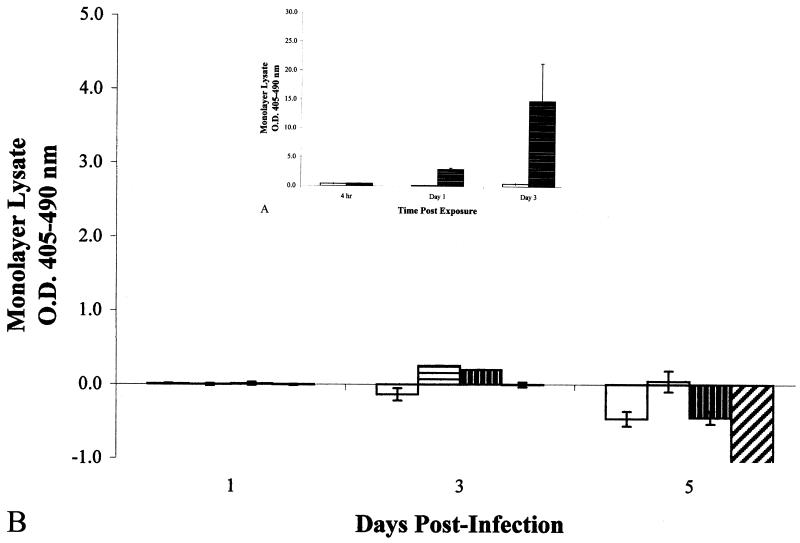
 , 0.005 mM camptothecin-treated
cells. Data shown are means from two experiments run in triplicate.
Error bars, standard deviations. (B) Optical densities of
intracellular histone-DNA complexes from the cell lysates of
infected epithelial cell monolayers. All monolayers were infected at an
MOI of 10:1. □, M. bovis BCG;
, 0.005 mM camptothecin-treated
cells. Data shown are means from two experiments run in triplicate.
Error bars, standard deviations. (B) Optical densities of
intracellular histone-DNA complexes from the cell lysates of
infected epithelial cell monolayers. All monolayers were infected at an
MOI of 10:1. □, M. bovis BCG;
 , M. tuberculosis
strain Erdman;
, M. tuberculosis
strain Erdman;  , M.
tuberculosis strain CDC1551;
, M.
tuberculosis strain CDC1551;
 , M. smegmatis. Data
shown are means from four different experiments of triplicate
monolayers. Error bars, standard errors. The values obtained were
normalized by subtraction of background levels of apoptosis of
uninfected A549 cell monolayers at each time point.
, M. smegmatis. Data
shown are means from four different experiments of triplicate
monolayers. Error bars, standard errors. The values obtained were
normalized by subtraction of background levels of apoptosis of
uninfected A549 cell monolayers at each time point.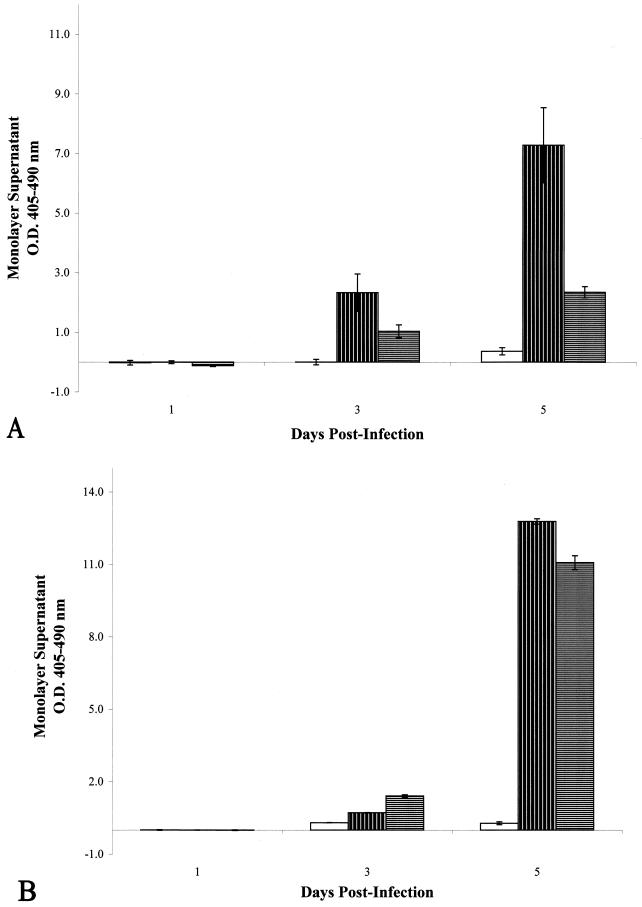
 , M. tuberculosis
CDC1551-infected, untreated cells;
, M. tuberculosis
CDC1551-infected, untreated cells;
 , M. tuberculosis
CDC1551-infected, streptomycin-treated cells. (B) Optical densities of
histone-DNA complexes released in the culture supernatants of infected
epithelial cell monolayers with or without treatment with the
eukaryotic protein synthesis inhibitor cycloheximide. □, uninfected,
cycloheximide-treated cells;
, M. tuberculosis
CDC1551-infected, streptomycin-treated cells. (B) Optical densities of
histone-DNA complexes released in the culture supernatants of infected
epithelial cell monolayers with or without treatment with the
eukaryotic protein synthesis inhibitor cycloheximide. □, uninfected,
cycloheximide-treated cells;  ,
M. tuberculosis CDC1551-infected, untreated cells;
,
M. tuberculosis CDC1551-infected, untreated cells;
 , M.
tuberculosis CDC1551-infected, cycloheximide-treated cells. All
monolayers were infected at an MOI of 10:1. Data shown are means from
two different experiments of triplicate monolayers. Error bars,
standard deviations. The values obtained were normalized by subtraction
of background levels of necrosis of uninfected A549 cell monolayers at
each time point.
, M.
tuberculosis CDC1551-infected, cycloheximide-treated cells. All
monolayers were infected at an MOI of 10:1. Data shown are means from
two different experiments of triplicate monolayers. Error bars,
standard deviations. The values obtained were normalized by subtraction
of background levels of necrosis of uninfected A549 cell monolayers at
each time point.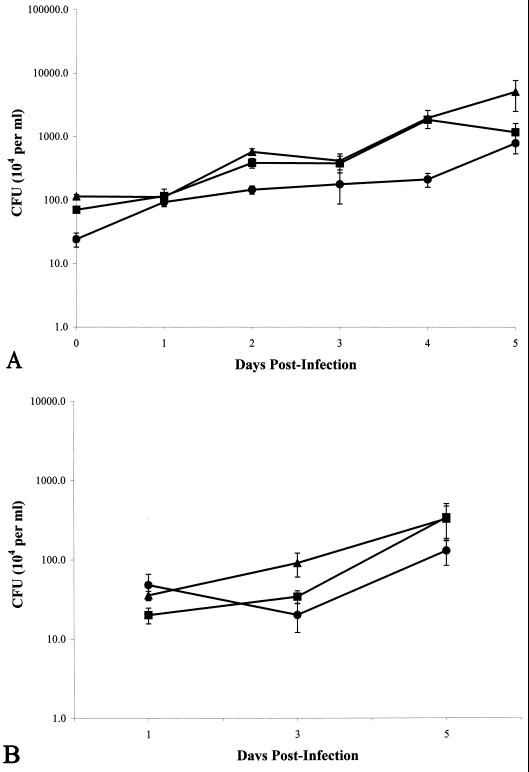
 ,
M. tuberculosis strain Erdman;
,
M. tuberculosis strain Erdman;
 , M.
tuberculosis strain CDC1551. All monolayers were infected at an
MOI of 10. All experiments were performed in triplicate. Error bars,
standard deviations.
, M.
tuberculosis strain CDC1551. All monolayers were infected at an
MOI of 10. All experiments were performed in triplicate. Error bars,
standard deviations.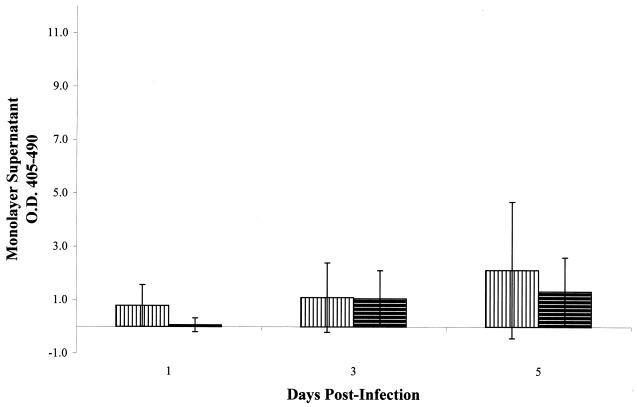
 , heat-killed
M. tuberculosis;
, heat-killed
M. tuberculosis;  ,
γ-irradiated M. tuberculosis. All monolayers were treated
with an inoculum equivalent to an MOI of 10. All experiments were
performed in triplicate. Error bars, standard deviations. The values
obtained were normalized by subtraction of background levels of
necrosis of untreated A549 cell monolayers at each time point.
,
γ-irradiated M. tuberculosis. All monolayers were treated
with an inoculum equivalent to an MOI of 10. All experiments were
performed in triplicate. Error bars, standard deviations. The values
obtained were normalized by subtraction of background levels of
necrosis of untreated A549 cell monolayers at each time point.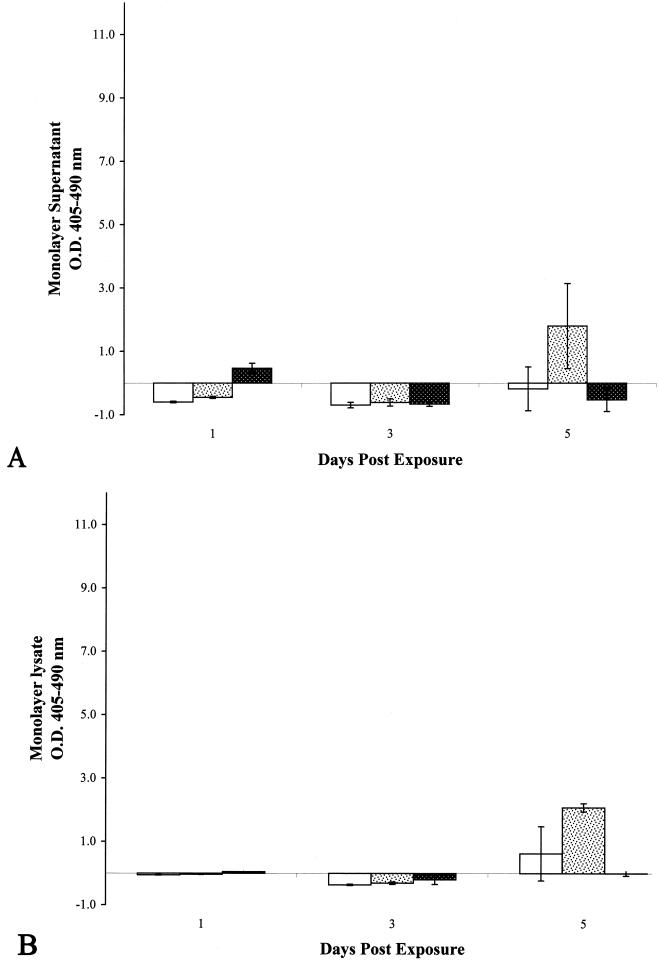
 , CW; ▩, WCL. All
monolayers were treated with a protein inoculum equivalent to an MOI of
100 bacilli per A549 cell. All experiments were performed in
triplicate. Error bars, standard deviations. The values obtained were
normalized by subtraction of background levels of necrosis and
apoptosis of untreated A549 cell monolayers at each time
point.
, CW; ▩, WCL. All
monolayers were treated with a protein inoculum equivalent to an MOI of
100 bacilli per A549 cell. All experiments were performed in
triplicate. Error bars, standard deviations. The values obtained were
normalized by subtraction of background levels of necrosis and
apoptosis of untreated A549 cell monolayers at each time
point.References
-
- Arruda S, Bomfim G, Knights R, Huima-Byron T, Riley L W. Cloning of a M. tuberculosisDNA fragment associated with entry and survival inside cells. Science. 1993;261:1454–1457. - PubMed
-
- Balasubrananian B, Wiegeshaus E H, Taylor G T, Smith D W. Pathogenesis of tuberculosis: pathway to apical localization. Tuber Lung Dis. 1994;75:168–178. - PubMed
-
- Barnes P F, Modlin R L. Human cellular immune responses to Mycobacterium tuberculosis. In: Shinnick T M, editor. Tuberculosis. Berlin, Germany: Springer; 1997. pp. 187–219.
-
- Behr M A, Wilson M A, Gill W P, Salamon H, Schoolnik G K, Rane S, Small P M. Comparative genomics of BCG vaccines by whole-genome DNA microarray. Science. 1999;284:1520–1522. - PubMed
-
- Bellocq A, Azoulay E, Marullo S, Flahault A, Fouquerary B, Philippe C, Cadranel J, Baud L. Reactive oxygen and nitrogen intermediates increase transforming growth factor-β1 release from human epithelial alveolar cells through two different mechanisms. Am J Respir Cell Mol Biol. 1999;21:128–136. - PubMed
Publication types
MeSH terms
Substances
Grants and funding
LinkOut - more resources
Full Text Sources
Other Literature Sources
