. 2000 Oct 24;97(22):12079-84.
doi: 10.1073/pnas.210134797.

Coupled two-way clustering analysis of gene microarray data

Affiliations

Coupled two-way clustering analysis of gene microarray data

G Getz et al. Proc Natl Acad Sci U S A. .

Abstract

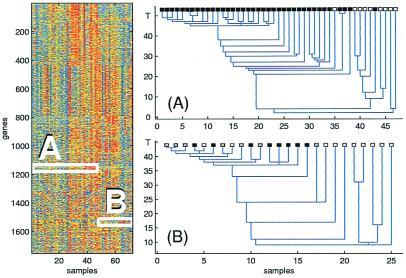
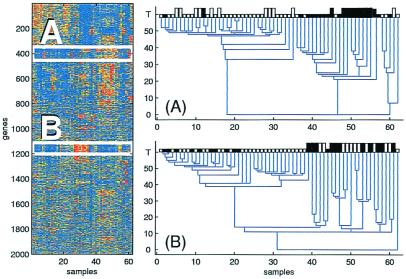
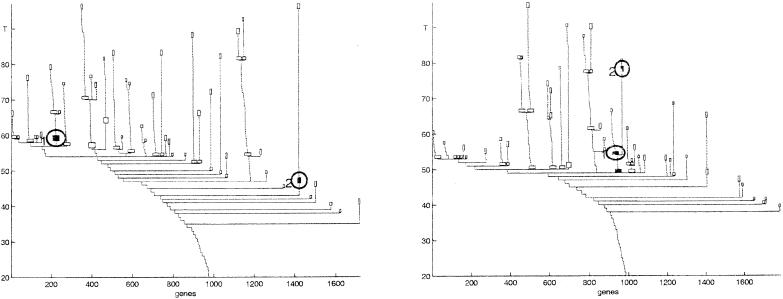
We present a coupled two-way clustering approach to gene microarray data analysis. The main idea is to identify subsets of the genes and samples, such that when one of these is used to cluster the other, stable and significant partitions emerge. The search for such subsets is a computationally complex task. We present an algorithm, based on iterative clustering, that performs such a search. This analysis is especially suitable for gene microarray data, where the contributions of a variety of biological mechanisms to the gene expression levels are entangled in a large body of experimental data. The method was applied to two gene microarray data sets, on colon cancer and leukemia. By identifying relevant subsets of the data and focusing on them we were able to discover partitions and correlations that were masked and hidden when the full dataset was used in the analysis. Some of these partitions have clear biological interpretation; others can serve to identify possible directions for future research.


Figures

Figure 1
Figure 1
The expression level matrix of the leukemia experiment is shown on the Left. Rows correspond to different genes, ordered by clustering them using all of the samples. The two boxes contain expression data from ALL patients (A) measured on one gene cluster and AML patients (B), on another gene cluster. On the Right, clustering the ALL samples, using the data in box A, yields good separation between T cell ALL (black) and B cell ALL (white). Clustering of AML samples, using the data in box B, yields a stable cluster, which contains all patients who were treated, with results known to be either success (black) or failure (gray). The vertical axis is the “temperature” parameter T, and on the horizontal axis the samples are ordered according to the dendrogram.
Figure 2
Figure 2
The expression level matrix of the colon experiment is shown on the Left. Rows correspond to different genes, ordered by clustering them using all of the samples. The two boxes contain expression data of all samples for two gene clusters. On the Right, when the genes of the first cluster (A) are used, clear separation between tumor samples (white) and normal ones (black) is obtained. Another separation of the samples is obtained by using the second gene cluster (B). This separation is consistent with two distinct experimental protocols, denoted by short and long bars. The vertical axis is the “temperature” parameter T and on the horizontal axis the samples are ordered according to the dendrogram.
Figure 3
Figure 3
Clustering genes of the colon cancer experiment, using all samples (Left) and using only tumor samples (Right) as the feature sets. Each node of this dendrogram represents a cluster; only clusters of size larger than 9 genes are shown. The last such clusters of each branch, as well as nonterminal clusters that were selected for presentation and analysis, are shown as boxes. In each dendrogram the genes are ordered according to the corresponding cluster analysis. The two circled clusters of the Left dendrogram are reproduced also in the Right, but there the two share a common “parent” in the tree. Note that the stability of a cluster is easily read off a dendrogram produced by the SPC algorithm.

References

    1. Alon U, Barkai N, Notterman D A, Gish K, Ybarra S, Mack D, Levine A J. Proc Natl Acad Sci USA. 1999;96:6745–6750. - PMC - PubMed
    1. Eisen M, Spellman P, Brown P, Botstein D. Proc Natl Acad Sci USA. 1998;95:14863–14868. - PMC - PubMed
    1. Golub T R, Slonim D K, Tamayo P, Huard C, Gaasenbeek M, Mesirov J P, Coller H, Loh M L, Downing J R, Caligiuri M A, et al. Science. 1999;286:531–537. - PubMed
    1. Perou C M, Jeffrey S S, van de Rijn M, Rees C A, Eisen M B, Ross D T, Pergamenschikov A, Williams C F, Zhu S X, Lee J C, et al. Proc Natl Acad Sci USA. 1999;96:9212–9217. - PMC - PubMed
    1. Lander E. Nat Genet. 1999;21:3–4. - PubMed

Publication types