

Stages of polymyxin B interaction with the Escherichia coli cell envelope
- PMID: 11036008
- PMCID: PMC101588
- DOI: 10.1128/AAC.44.11.2969-2978.2000
Stages of polymyxin B interaction with the Escherichia coli cell envelope
Abstract
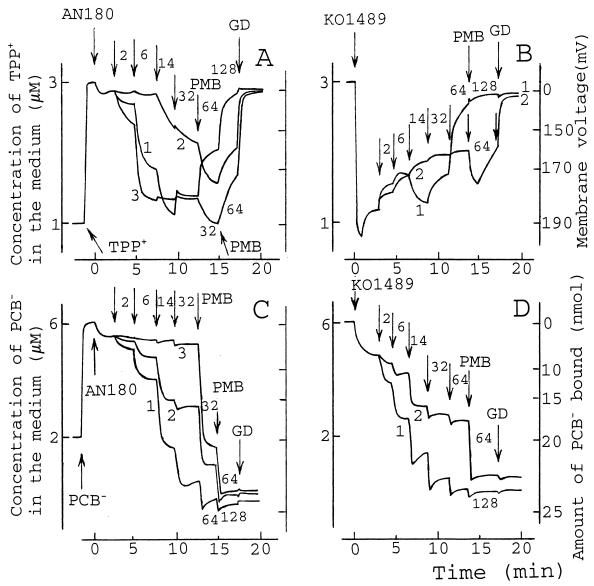
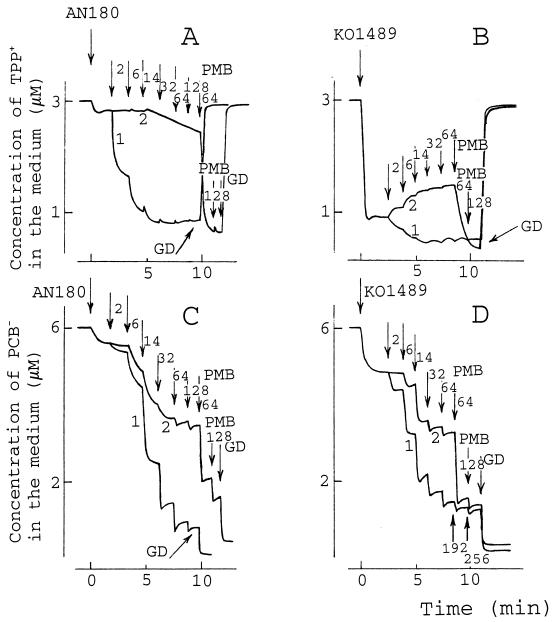
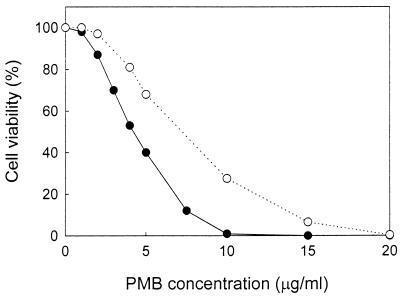
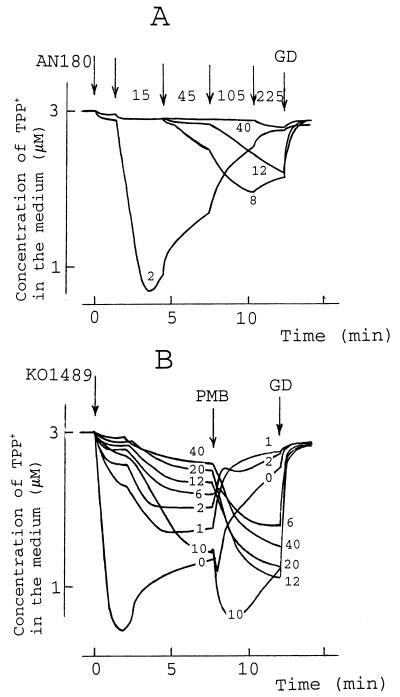
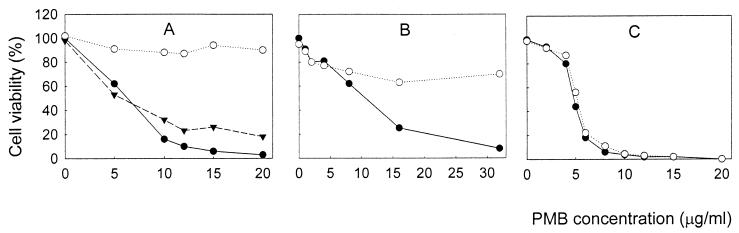
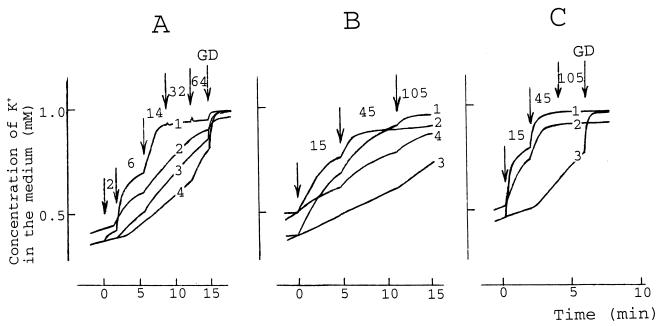
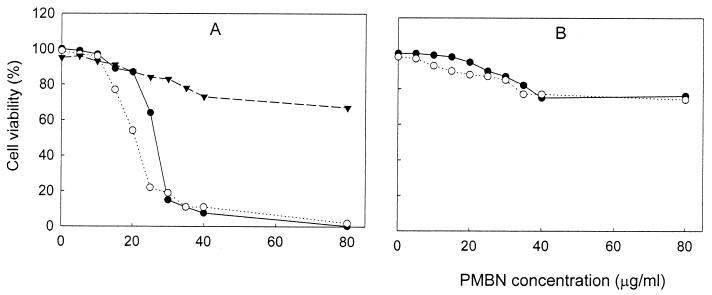
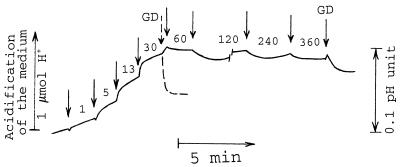
The effects of polymyxin B (PMB) on the Escherichia coli outer (OM) and cytoplasmic membrane (CM) permeabilities were studied by monitoring the fluxes of tetraphenylphosphonium, phenyldicarbaundecaborane, and K(+) and H(+) ions. At concentrations between 2 and 20 microgram/ml, PMB increased the OM permeability to lipophilic compounds and induced a leakage of K(+) from the cytosol and an accumulation of lipophilic anions in the cellular membranes but did not cause the depolarization of the CM. At higher concentrations, PMB depolarized the CM, forming ion-permeable pores in the cell envelope. The permeability characteristics of PMB-induced pores mimic those of bacteriophage- and/or bacteriocin-induced channels. However, the bactericidal effect of PMB took place at concentrations below 20 microgram/ml, indicating that this effect is not caused by pore formation. Under conditions of increased ionic strength, PMB made the OM permeable to lipophilic compounds and decreased the K(+) gradient but was not able to depolarize the cells. The OM-permeabilizing effect of PMB can be diminished by increasing the concentration of Mg(2+). The major new findings of this work are as follows: (i) the OM-permeabilizing action of PMB was dissected from its depolarizing effect on the CM, (ii) the PMB-induced ion-permeable pores in bacterial envelope were registered, and (iii) the pore formation and depolarization of the CM are not obligatory for the bactericidal action of PMB and dissipation of the K(+) gradient on the CM.
Figures
Similar articles
-
Characterizing the effect of polymyxin B antibiotics to lipopolysaccharide on Escherichia coli surface using atomic force microscopy.J Mol Recognit. 2017 Jun;30(6). doi: 10.1002/jmr.2605. Epub 2017 Jan 5. J Mol Recognit. 2017. PMID: 28054415
-
Effect of sodium deoxycholate sulfate on outer membrane permeability and neutralization of bacterial lipopolysaccharides by polymyxin B formulations.Int J Pharm. 2020 May 15;581:119265. doi: 10.1016/j.ijpharm.2020.119265. Epub 2020 Mar 23. Int J Pharm. 2020. PMID: 32217155
-
Polymyxin B induces lysis of marine pseudoalteromonads.Antimicrob Agents Chemother. 2007 Nov;51(11):3908-14. doi: 10.1128/AAC.00449-07. Epub 2007 Aug 20. Antimicrob Agents Chemother. 2007. PMID: 17709471 Free PMC article.
-
Polymyxin B-Polysaccharide Polyion Nanocomplex with Improved Biocompatibility and Unaffected Antibacterial Activity for Acute Lung Infection Management.Adv Healthc Mater. 2020 Feb;9(3):e1901542. doi: 10.1002/adhm.201901542. Epub 2020 Jan 3. Adv Healthc Mater. 2020. PMID: 31898875
-
Antimicrobial activity and cellular toxicity of nanoparticle-polymyxin B conjugates.Nanotechnology. 2011 May 6;22(18):185101. doi: 10.1088/0957-4484/22/18/185101. Epub 2011 Mar 17. Nanotechnology. 2011. PMID: 21415471
Cited by
-
Sensitization of Gram-negative bacteria to rifampin and OAK combinations.Sci Rep. 2015 Mar 18;5:9216. doi: 10.1038/srep09216. Sci Rep. 2015. PMID: 25782773 Free PMC article.
-
Polymyxin Resistance and Heteroresistance Are Common in Clinical Isolates of Achromobacter Species and Correlate with Modifications of the Lipid A Moiety of Lipopolysaccharide.Microbiol Spectr. 2023 Feb 14;11(1):e0372922. doi: 10.1128/spectrum.03729-22. Epub 2022 Dec 15. Microbiol Spectr. 2023. PMID: 36519943 Free PMC article.
-
Decoration of Pasteurella multocida lipopolysaccharide with phosphocholine is important for virulence.J Bacteriol. 2007 Oct;189(20):7384-91. doi: 10.1128/JB.00948-07. Epub 2007 Aug 17. J Bacteriol. 2007. PMID: 17704225 Free PMC article.
-
Unveiling the Membrane and Cell Wall Action of Antimicrobial Cyclic Lipopeptides: Modulation of the Spectrum of Activity.Pharmaceutics. 2021 Dec 17;13(12):2180. doi: 10.3390/pharmaceutics13122180. Pharmaceutics. 2021. PMID: 34959460 Free PMC article.
-
Tuneable poration: host defense peptides as sequence probes for antimicrobial mechanisms.Sci Rep. 2018 Oct 8;8(1):14926. doi: 10.1038/s41598-018-33289-y. Sci Rep. 2018. PMID: 30297841 Free PMC article.
References
-
- Boulanger B, Letellier L. Characterization of ion channels involved in the penetration of phage T4 DNA into Escherichia coli cells. J Biol Chem. 1988;263:9767–9775. - PubMed
-
- Bühler R, Stürmer W, Apell H-J, Läuger P. Charge translocation by the Na, K-pump. I. Kinetics of local field changes studies by time-resolved fluorescence measurement. J Membr Biol. 1991;121:141–161. - PubMed
-
- Cajal Y, Rogers J, Berg O G, Jain M K. Intermembrane molecular contacts by polymyxin B mediate exchange of phospholipids. Biochemistry. 1996;35:299–308. - PubMed
Publication types
MeSH terms
Substances
LinkOut - more resources
Full Text Sources
Other Literature Sources
Medical
