. 1996 Dec 24;93(26):15503-7.
doi: 10.1073/pnas.93.26.15503.

High-resolution mapping and isolation of a yeast artificial chromosome contig containing fw2.2: a major fruit weight quantitative trait locus in tomato

Affiliations

High-resolution mapping and isolation of a yeast artificial chromosome contig containing fw2.2: a major fruit weight quantitative trait locus in tomato

K B Alpert et al. Proc Natl Acad Sci U S A. .

Abstract

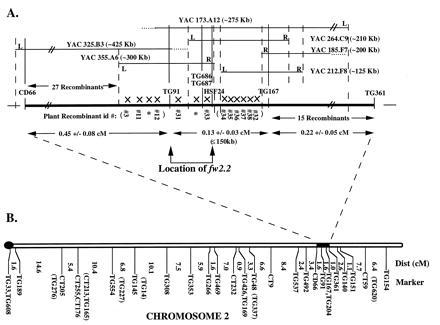
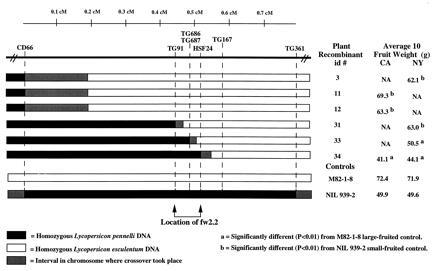
A high-resolution physical and genetic map of a major fruit weight quantitative trait locus (QTL), fw2.2, has been constructed for a region of tomato chromosome 2. Using an F(2) nearly isogenic line mapping population (3472 individuals) derived from Lycopersicon esculentum (domesticated tomato) x Lycopersicon pennellii (wild tomato), fw2.2 has been placed near TG91 and TG167, which have an interval distance of 0.13 +/- 0.03 centimorgan. The physical distance between TG91 and TG167 was estimated to be </= 150 kb by pulsed-field gel electrophoresis of tomato DNA. A physical contig composed of six yeast artificial chromosomes (YACs) and encompassing fw2.2 was isolated. No rearrangements or chimerisms were detected within the YAC contig based on restriction fragment length polymorphism analysis using YAC-end sequences and anchored molecular markers from the high-resolution map. Based on genetic recombination events, fw2.2 could be narrowed down to a region less than 150 kb between molecular markers TG91 and HSF24 and included within two YACs: YAC264 (210 kb) and YAC355 (300 kb). This marks the first time, to our knowledge, that a QTL has been mapped with such precision and delimited to a segment of cloned DNA. The fact that the phenotypic effect of the fw2.2 QTL can be mapped to a small interval suggests that the action of this QTL is likely due to a single gene. The development of the high-resolution genetic map, in combination with the physical YAC contig, suggests that the gene responsible for this QTL and other QTLs in plants can be isolated using a positional cloning strategy. The cloning of fw2.2 will likely lead to a better understanding of the molecular biology of fruit development and to the genetic engineering of fruit size characteristics.


Figures

Figure 1
Figure 1
High-resolution physical and molecular map of fw2.2 on tomato chromosome 2. (A) The high-resolution map of fw2.2 is delineated by CD66 and TG361. The map position (dashed vertical lines) of YAC iPCR “right”-end (R) and “left”-end (L) sequences was determined by genetic mapping using the recombinants (X), while the physical placement (solid vertical lines) of YACs was determined by RFLP analysis using genomic, cDNA, and RAPD molecular markers. Ends of YACs that could not be genetically mapped are shown with dotted horizontal lines. The physical size, in kilobases (kb), of the YACs and the distance spanning TG91 and TG167 (≤150 kb) was determined by PFGE and DNA hybridization. The location of fw2.2 (bracketed by arrows) was determined by the phenotypic data associated with recombinants #31 and #33 (Fig. 2). The map distances with standard deviations, in centimorgans (cM), were calculated based on the number of recombinants obtained from the F2 population divided by the total number of meioses (6944) times 100. Plants that died (∗) were included in the number of recombinants for mapping purposes. The map order of the recombinants in parentheses has not been determined. (B) Tomato chromosome 2 high-density linkage map (L. esculentum × L. pennellii; ref. 20). The Kosambi mapping function was used to convert recombination frequencies to map distances in centimorgans (cM) (33). Markers with tick marks were ordered with LOD > 3. Markers enclosed in parentheses were located to corresponding intervals with LOD < 3. The black knob indicates the location of the centromere. The black box indicates the region corresponding (expanding dotted line) to the high-resolution map of fw2.2 in A.
Figure 2
Figure 2
Graphical genotypes of homozygous recombinants in the fw2.2 region of chromosome 2. Five replications of each recombinant plant were grown in California (CA) and New York (NY). The average gram (g) weight of 10 fruit from each recombinant was compared with the large-fruited, M82-1-8, and the small-fruited, NIL 939–2, controls. Recombinants #3, #11, #12, and #31 were significantly larger (b; P < 0.01) for average 10 fruit weight in comparison to the small-fruited control, NIL 939–2, while recombinants #33 and #34 were significantly smaller (a; P < 0.01) for average 10 fruit weight in comparison to the large-fruited control, M82-1-8. Recombinants #31 and #33 delineate the fw2.2 region (bracketed by arrows), based on the smallest region demonstrating statistical significance. Plants for which few or no fruit were harvested due to pest infection were not available (NA) for fruit weight analysis. The black and white boxes indicate the homozygous condition for L. pennellii (NIL 939–2) and L. esculentum (M82-1-8) at the molecular markers, respectively. The gray boxes indicate the approximate position between two molecular markers where the genetic recombination event took place. The genetic distance between molecular markers (separated by dashed lines) is indicated by the scale shown in centimorgans (cM; Fig. 1).

References

    1. Johanssen W. Elemente der exakten Erblichkeitsllehre. Jena, Germany: Fischer; 1909.
    1. Nilsson-Ehle H. Lunds Univ Arsskr Avd 2. 1909;5:1–122.
    1. East E M. Genetics. 1915;1:164–176. - PMC - PubMed
    1. Paterson A H, Lander E S, Hewitt J D, Peterson S, Lincoln S E, Tanksley S D. Nature (London) 1988;335:721–726. - PubMed
    1. Paterson A H, DeVerna J W, Lanini B, Tanksley S D. Genetics. 1990;124:735–742. - PMC - PubMed

LinkOut - more resources