. 1997 Jun 24;94(13):7103-8.
doi: 10.1073/pnas.94.13.7103.

Purified vesicles of tobacco cell vacuolar and plasma membranes exhibit dramatically different water permeability and water channel activity

Affiliations

Purified vesicles of tobacco cell vacuolar and plasma membranes exhibit dramatically different water permeability and water channel activity

C Maurel et al. Proc Natl Acad Sci U S A. .

Abstract

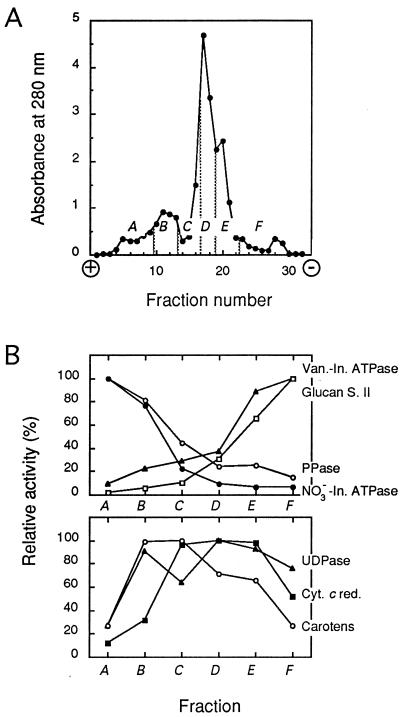
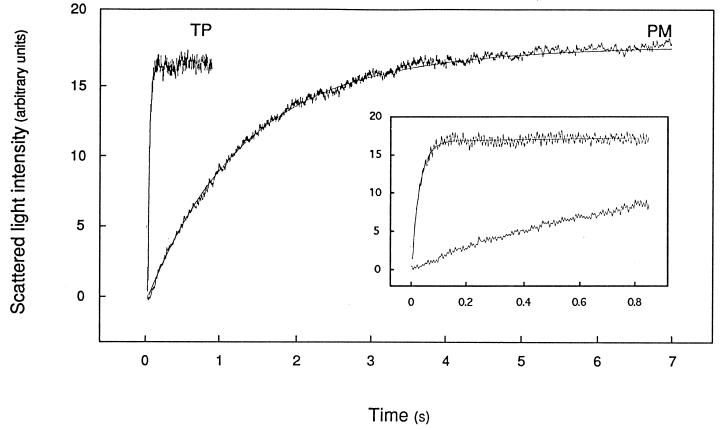
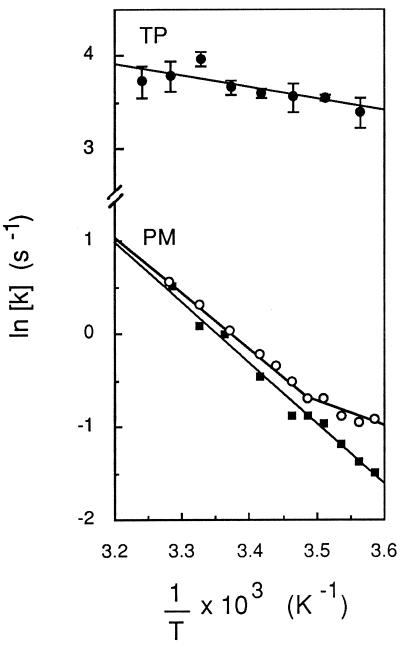
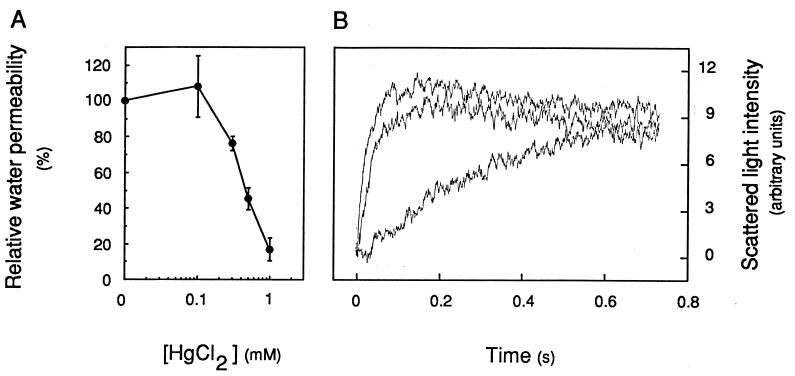
The vacuolar membrane or tonoplast (TP) and the plasma membrane (PM) of tobacco suspension cells were purified by free-flow electrophoresis (FFE) and aqueous two-phase partitioning, with enrichment factors from a crude microsomal fraction of >/=4- to 5-fold and reduced contamination by other cellular membranes. For each purified fraction, the mean apparent diameter of membrane vesicles was determined by freeze-fracture electron microscopy, and the osmotic shrinking kinetics of the vesicles were characterized by stopped-flow light scattering. Osmotic water permeability coefficients (Pf) of 6.1 +/- 0.2 and 7.6 +/- 0.9 microm . s(-1) were deduced for PM-enriched vesicles purified by FFE and phase partitioning, respectively. The associated activation energies (Ea; 13.7 +/- 1.0 and 13.4 +/- 1.4 kcal . mol(-1), respectively) suggest that water transport in the purified PM occurs mostly by diffusion across the lipid matrix. In contrast, water transport in TP vesicles purified by FFE was characterized by (i) a 100-fold higher Pf of 690 +/- 35 microm . s(-1), (ii) a reduced Ea of 2.5 +/- 1.3 kcal . mol(-1), and (iii) a reversible inhibition by mercuric chloride, up to 83% at 1 mM. These results provide functional evidence for channel-mediated water transport in the TP, and more generally in a higher plant membrane. A high TP Pf suggests a role for the vacuole in buffering osmotic fluctuations occurring in the cytoplasm. Thus, the differential water permeabilities and water channel activities observed in the tobacco TP and PM point to an original osmoregulatory function for water channels in relation to the typical compartmentation of plant cells.


Figures

Figure 1
Figure 1
FFE separation of tobacco cell membranes. (A) Representative separation profile determined by absorbance at 280 nm. A–F, pooled fractions. (B) Membrane marker activities in the A–F membrane fractions expressed as the percentage of the highest specific activity detected in either fraction. Mean data from four independent membrane separations and enzymatic activity measurements are shown. Specific activities at 37°C (100%; in millimoles per hour per milligram of protein) were as follows: vanadate-inhibited ATPase (Van.-In. ATPase; ▴), 9.25; glucan synthase II (Glucan S. II; □), 4.57; pyrophosphatase (PPase; ○), 9.32; NO3-inhibited ATPase (NO3-In. ATPase; •), 2.37; latent uridine-5′-diphosphatase (UDPase; ▴), 8.50; NADPH-cytochrome c reductase (Cyt. c red.; ▪), 25.20; carotenoids (Carotens; ○), 100% represents 3.07 mg per mg of protein.
Figure 2
Figure 2
Time course of increased scattered light intensity in PM- and TP-enriched membrane vesicles. Membranes were purified by FFE, resuspended in 50 mM mannitol/5 mM KCl/1 mM MgCl2/20 mM Mes–Tris, pH 6.0 (Cin = 92 mosmol⋅kg−1), and submitted in a stopped-flow apparatus (t = 20.0°C) to an 82 mosmol⋅kg−1 inwardly directed mannitol gradient (Cout = 174 mosmol⋅kg−1) at time 0. The figure shows for both types of membrane preparations a typical experiment with the average trace of five to seven individual shots and the fitted monoexponential function. (Inset) Same recordings on a reduced time scale. The monoexponential rate constant (k) and the deduced osmotic water permeability (Pf) were as follows: PM, k = 0.77 s−1, Pf = 6.2 μm⋅s−1; TP, k = 34.7 s−1, Pf = 682 μm⋅s−1.
Figure 3
Figure 3
Effects of external osmolality on the time-dependent changes in scattered light intensity. PM- and TP-enriched membrane vesicles were purified by FFE, resuspended in 50 mM mannitol/5 mM KCl/1 mM MgCl2/20 mM Mes–Tris, pH 6.0 (Cin= 92 mosmol⋅kg−1), and exposed, as exemplified in Fig. 2, to external media of different osmolalities (Cout) obtained by addition of mannitol to the vesicle suspension buffer. (A) Effects of the size of the imposed osmotic gradient, expressed as Cout/Cin, on the maximal amplitude of change in scattered light intensity. (B) Effects of Cout on the fitted monoexponential rate constant. Straight lines were fitted to the experimental data by a least-squares protocol. Note that data for PM and TP are plotted along different ordinates.
Figure 4
Figure 4
Temperature dependence of osmotic water transport in PM- and TP-enriched vesicles. Exponential rate constants (k) of vesicle osmotic shrinking were determined at the indicated temperature (T), as exemplified in Fig. 2. Data were plotted in an Arrhenius representation and activation energy (Ea) values were deduced from the slope of lines fitted by linear regression to the experimental data. For TP (•), mean values from measurements of three independent membrane preparations are shown, and Ea = 2.5 ± 1.3 kcal⋅mol−1. For PM (○ and ▪), data from two individual FFE membrane preparations are shown. ▪, Ea = 12.5 kcal⋅mol−1; ○, for 103/T ≤ 3.487 K−1 (t ≥ 13.8°C), Ea = 12.0 kcal⋅mol−1; for 103/T ≥ 3.487 K−1 (t ≤ 13.8°C), Ea = 5.4 kcal⋅mol−1.
Figure 5
Figure 5
Mercury inhibition of osmotic water transport in TP-enriched vesicles. (A) Dose dependence of inhibition. Vesicles were preincubated at room temperature for 5 min at the indicated HgCl2 concentration; Pf values were measured at 20°C in the presence of an 80 mosmol⋅kg−1 mannitol gradient and were reported to the Pf value measured in control untreated vesicles. (B) Reversion of mercury inhibition by a reducing agent. Top curve, untreated control (k = 43.9 s−1); middle curve, after exposure for 5 min to 1 mM HgCl2 and for 15 min with the addition of 10 mM 2-mercaptoethanol (k = 31.5 s−1); bottom curve, after exposure for 5 min to 1 mM HgCl2 (k = 4.2 s−1). Note that the slowly decaying plateau of the top and middle curves may indicate a slight permeability of the TP vesicles to mannitol in this experiment.

References

    1. Steudle E. In: Flux Control in Bological Systems: From Enzymes to Populations and Ecosystems. Schultze E D, editor. San Diego: Academic; 1994. pp. 237–299.
    1. Finkelstein A. Distinguished Lecture Series of the Society of General Physiologists. Vol. 4. New York: Wiley; 1987. pp. 1–228.
    1. Url W G. Protoplasma. 1971;72:427–447.
    1. Collander R. In: Plant Physiology: A Treatise. Steward F C, editor. New York and London: Academic; 1959. pp. 3–102.
    1. Zimmermann U. Methods Enzymol. 1989;174:338–366.

LinkOut - more resources