. 1997 Aug 5;94(16):8901-6.
doi: 10.1073/pnas.94.16.8901.

enod40 induces dedifferentiation and division of root cortical cells in legumes

Affiliations

enod40 induces dedifferentiation and division of root cortical cells in legumes

C Charon et al. Proc Natl Acad Sci U S A. .

Abstract

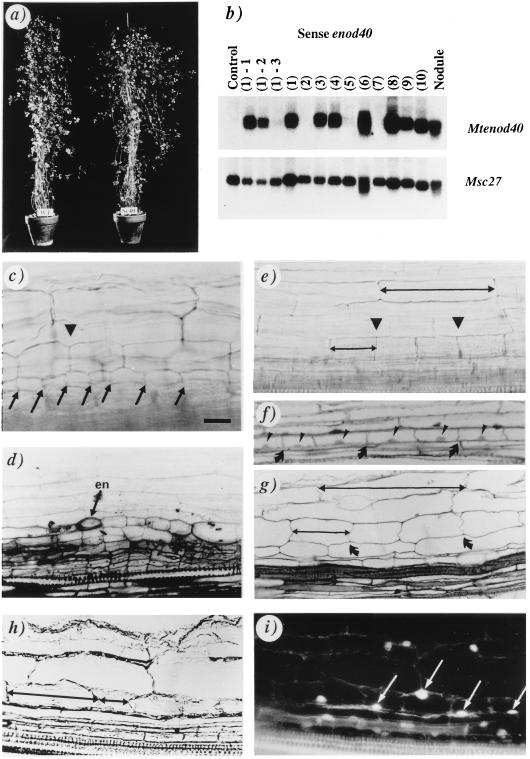
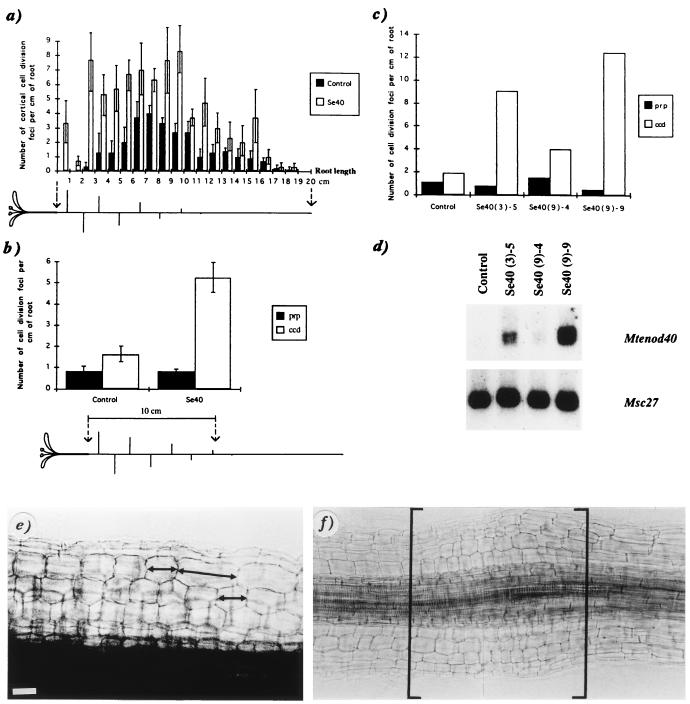
Under nitrogen-limiting conditions Rhizobium meliloti can establish symbiosis with Medicago plants to form nitrogen-fixing root nodules. Nodule organogenesis starts with the dedifferentiation and division of root cortical cells. In these cells the early nodulin gene enod40, which encodes an unusually small peptide (12 or 13 amino acids), is induced from the beginning of this process. Herein we show that enod40 expression evokes root nodule initiation. (i) Nitrogen-deprived transgenic Medicago truncatula plants overexpressing enod40 exhibit extensive cortical cell division in their roots in the absence of Rhizobium. (ii) Bombardment of Medicago roots with an enod40-expressing DNA cassette induces dedifferentiation and division of cortical cells and the expression of another early nodulin gene, Msenod12A. Moreover, transient expression of either the enod40 region spanning the oligopeptide sequence or only the downstream region without this sequence induces these responses. Our results suggest that the cell-specific growth response elicited by enod40 is involved in the initiation of root nodule organogenesis.


Figures

Figure 1
Figure 1
Analysis of M. truncatula transgenic plants carrying the 35S–Mtenod40 construct. (a) An F2 plant (Se40) overexpressing Mtenod40 compared with a wild-type plant (WT). (b) Northern blot analysis of one control and 10 transgenic enod40 plants with an Mtenod40 probe. Progeny of the enod40 transgenic plant 1 [lanes (1)-1 to (1)-3] are also included. Msc27 was used as RNA-loading control (see ref. 7). (c and d) Lateral root primordia with dividing cortical cells (arrowhead) and divisions in the pericycle (arrows; en, endodermis). (e–i) Mtenod40-induced cortical cell division (e, arrowheads; f and g, arrows). Divisions of pericycle cells cannot be detected. A nucleus is present in each cell (f and i). Compare the size of undivided and divided cortical cells (double arrows in e, g, and h). Dividing cortical cells in a bright-field micrograph (h), showing fluorescent nuclei after 4,6-diamidino-2-phenylindole staining (arrows in i). Whole roots (c and e), 2-μm sections (d, f, and g), 14-μm sections (h and i). [Bar = 20 μm (c, e, h, and i) and 25 μm (d, f, and g).]
Figure 2
Figure 2
Correlation between Mtenod40 overexpression and cortical cell division under nitrogen limitation. (a) Number of cortical cell division along the main root for three controls and three independent enod40 plants (Se40) as a function of the distance from the hypocotyl (mean ± SEM). The increase in the number of cortical cell divisions cosegregated 1:1 with the level of transgene expression in the progeny (data not shown). (b) Numbers of cell division foci (ccd, cortical cell divisions, or prp, putative root primordia), in the main root along the first 10 cm below the hypocotyl, for four controls and six independent transgenics (progenies of transgenic lines Se40–3, Se40–9, and Se40–10; mean ± SEM). A plant, with main and lateral roots, is schematically represented below the graph (a and b). (c) Numbers of cell division foci (ccd or prp), along the upper 10 cm of the root, for three transgenic individuals (progeny of Se40–3 and Se40–9) and one control individual. Roots were used for microscopical analysis, and the leaves were used for Northern blot analysis (d) of these individual plants. Root region of an enod40 transgenic plant showing different sizes of cortical cells (e) and an increased diameter due to extensive cortical divisions (in brackets) (f). [Bar = 20 μm (e) and 40 μm (f).]
Figure 3
Figure 3
Transient gene expression in roots of transgenic plants carrying an Msenod12AuidA fusion after particle bombardment: Optimization bombardments: root bombarded with vector DNA [pDH51 (19)] (a) or with a 35S–uidA construct (20) (b). Blue spots correspond to cells transiently expressing GUS. (c) A cortical cell showing GUS activity with a gold particle (within the ring) in the nucleus. enod40 bombardments: division of cortical cells expressing Msenod12A (blue) in a root bombarded with a 35S–Mtenod40 construct (d). (e) Interference contrast micrograph of a cortical cell division after bombardment as in d. (f and g) Cortical cell division with accumulated amyloplasts (arrows) as seen in 2-μm sections after toluidine blue (f) and Lugol staining (g), respectively. (h) Autofluorescence revealed nuclei (arrows) in dividing cells (8-μm section). (i) Transversal section (8 μm) showing cell divisions (white bracket) outside the endodermis (fluorescent cell walls; en) in front of a xylem pole (x). ph, Phloem tissue. Large and small arrows are as in Fig. 1e. [Bar = 100 μm (a and b), 12 μm (c and i), 25 μm (d–g), and 20 μm (h).]

References

    1. Hirsch A M. New Phytol. 1992;122:211–237. - PubMed
    1. Mylona P, Pawlowski K, Bisseling T. Plant Cell. 1995;7:869–885. - PMC - PubMed
    1. Lerouge P, Roche P, Faucher C, Maillet F, Truchet G, Promé J C, Dénarié J. Nature (London) 1990;344:781–784. - PubMed
    1. Bauer P, Ratet P, Crespi M D, Schultze M, Kondorosi A. Plant J. 1996;10:91–105. - PMC - PubMed
    1. Yang W-C, Katinakis P, Hendriks P, Smolders A, de Vries F, Spee J, van Kammen A, Bisseling T, Franssen H. Plant J. 1993;3:573–585. - PubMed

LinkOut - more resources