. 1997 Mar 4;94(5):1857-61.
doi: 10.1073/pnas.94.5.1857.

Plant diversity and ecosystem productivity: theoretical considerations

Affiliations

Plant diversity and ecosystem productivity: theoretical considerations

D Tilman et al. Proc Natl Acad Sci U S A. .

Abstract

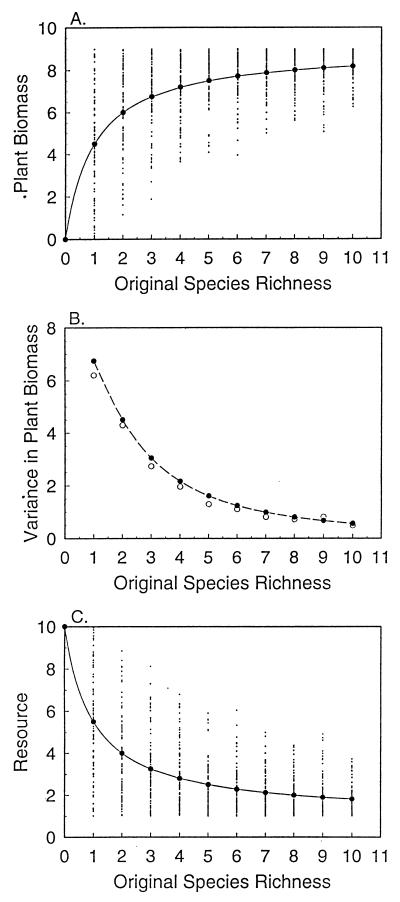
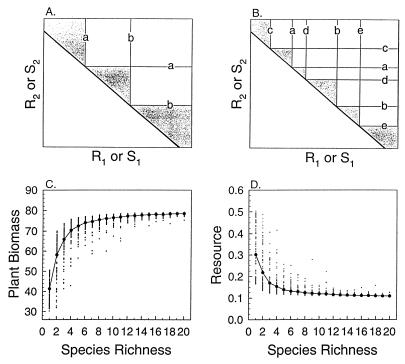
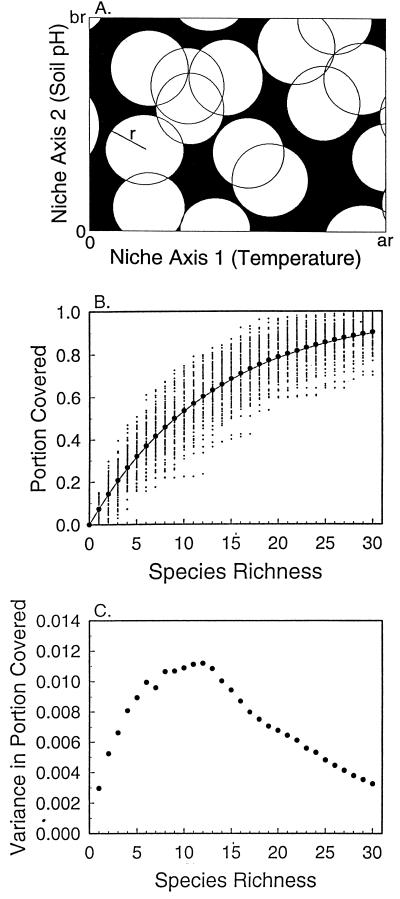
Ecosystem processes are thought to depend on both the number and identity of the species present in an ecosystem, but mathematical theory predicting this has been lacking. Here we present three simple models of interspecific competitive interactions in communities containing various numbers of randomly chosen species. All three models predict that, on average, productivity increases asymptotically with the original biodiversity of a community. The two models that address plant nutrient competition also predict that ecosystem nutrient retention increases with biodiversity and that the effects of biodiversity on productivity and nutrient retention increase with interspecific differences in resource requirements. All three models show that both species identity and biodiversity simultaneously influence ecosystem functioning, but their relative importance varies greatly among the models. This theory reinforces recent experimental results and shows that effects of biodiversity on ecosystem functioning are predicted by well-known ecological processes.


Figures

Figure 1
Figure 1
Multispecies competition for a single resource. (A) Biomass increases with original species richness in simulations in which R* values for each of N species were drawn randomly from a uniform distribution on the interval [1, 10], and the best competitor among them (the lowest R*) identified. ·, the biomass of that best competitor, computed with a = 1, Q = 1, and S = 10, for each of 100 cases at each level of N. The solid curve and • were analytically calculated using Eq. 3. (B) Variance in biomass calculated from simulations (○) and analytically with Eq. 4 (•, curve) using parameters above. (C) Ambient level of resource remaining unused in the habitat versus original species richness. ·, resource levels for individual simulations and • and curve are predicted by Model 1.
Figure 2
Figure 2
Competition for two resources. (A) Competition among two species (a and b) for two limiting essential resources (as in ref. 23). Curves labeled a and b are resource-dependent zero net-growth isoclines for species a and b. The thick diagonal line is the interspecific tradeoff curve, i.e., the lowest concentrations of the two resources for which any plant species can survive. Resources outside the tradeoff curve are potentially consumable. Shaded regions show unconsumed, but potentially consumable, resources. (B) A similar case, but with five species (labeled a–e). Note the greater resource use as indicated by the lower area (shaded) of unconsumed, but consumable, resources. (C) Results of simulations of the underlying analytical model (23) for a heterogeneous environment with 1000 different resource supply points and with N species drawn randomly from an unlimited pool of species with zero net-growth isoclines touching the tradeoff curve R*2 = 1/5 m R*1. ·, individual samples of N species; •, means of those samples. Each mean summarizes 100 samples; each sample averages across a heterogeneous habitat containing 1000 supply points in an elliptical cloud. (D) Levels of resource 2 occurring in simulations for C.
Figure 3
Figure 3
Orthogonal niche axes. (A) Circular niches of radius r randomly intersecting a habitat space with orthogonal axes of lengths ar and br. (B) Expected portion of habitat space covered by species increases asymptotically with number of species in the community. One-thousand trials were made for each value, N, of species richness. In each trial, a set of N circular niches of radius 0.218 were randomly placed on a habitat space in which axes ranged from 0 to 1, and the portion of the habitat space covered by this set of N species determined. At least some part of the niche (circle, A) of a species had to intersect the habitat space. •, means of 1000 trials. ·, 100 random trials for each value of N. The solid curve is the theoretical value from Eq. 5. (C) Variance in coverage declines to zero from a peak at intermediate values of species richness.

References

    1. Ewel J J, Mazzarino M J, Berish C W. Ecol Appl. 1991;1:289–302. - PubMed
    1. Vitousek P M, Hooper D U. In: Biodiversity and Ecosystem Function. Schulze E-D, Mooney H A, editors. Berlin: Springer; 1993. pp. 3–14.
    1. Naeem S, Thompson L J, Lawler S P, Lawton J H, Woodfin R M. Philos Trans R Soc London B. 1995;347:249–262.
    1. Naeem S, Thompson L J, Lawler S P, Lawton J H, Woodfin R M. Nature (London) 1994;368:734–737.
    1. Tilman D, Downing J A. Nature (London) 1994;367:363–365.

LinkOut - more resources