

Effects of three different doses of a bolus injection of gadodiamide: assessment of regional cerebral blood volume maps in a blinded reader study
- PMID: 11039338
- PMCID: PMC8174869
Effects of three different doses of a bolus injection of gadodiamide: assessment of regional cerebral blood volume maps in a blinded reader study
Abstract
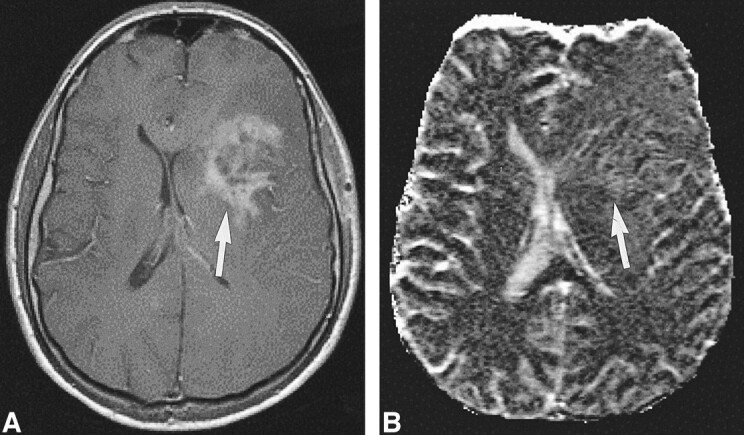
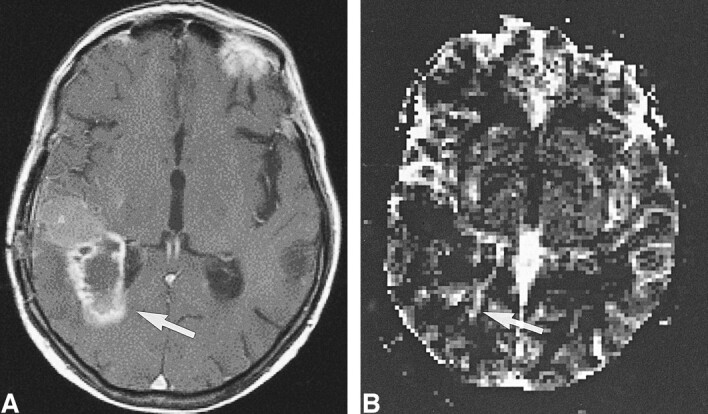
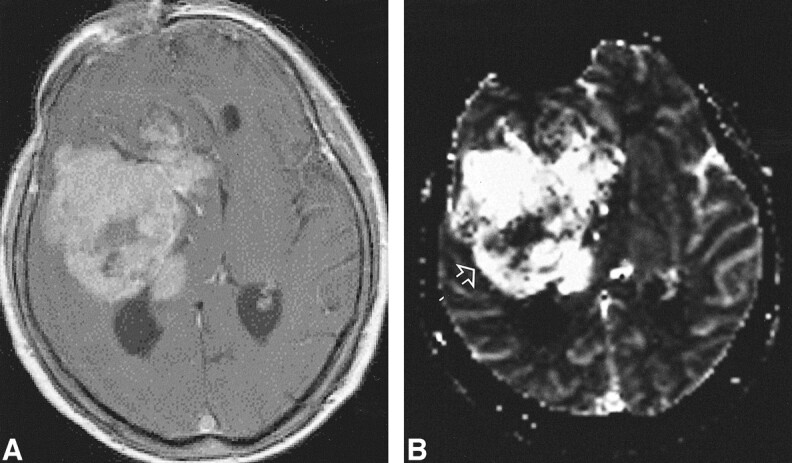
Background and purpose: Reconstruction of first-pass bolus information to derive regional cerebral blood volume (rCBV) maps is commonly performed in many centers; however, various protocols with different doses of paramagnetic contrast injections have been reported. We evaluated the dose dependency of rCBV maps in a brain tumor population by using three different doses of gadodiamide injection to evaluate their diagnostic accuracy in blinded reader sessions.
Methods: Eighty-three patients with intraaxial brain tumors (72 gliomas) were studied at three centers and randomized to receive a bolus injection of 0.1, 0.2, or 0.3 mmol/kg per body weight of gadodiamide. rCBV maps were generated from T2*-weighted gradient-echo echoplanar sequences at 1.5 T. Data processing was performed according to the indicator dilution theory.
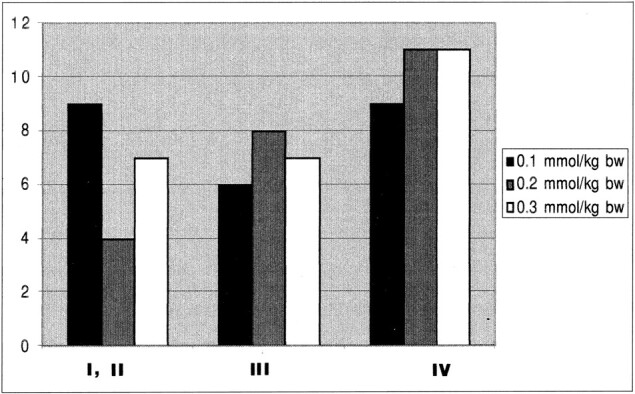
Results: The mean contrast-to-noise ratio (CNR) was significantly different between gadodiamide doses of 0.1 and 0.2 mmol/kg (CNR = 8.7 and 15.7) and between 0.1 and 0.3 mmol/kg (CNR = 17.7). No significant difference was found between doses of 0.2 and 0.3 mmol/kg. Sensitivity for the differentiation of benign and malignant brain tumors was 80%, 95%, and 91%, and specificity was 45%, 54%, and 43% by blinded readings at 0.1, 0.2, and 0.3 mmol/ kg, respectively, as compared with histologic findings. Nonblinded readings had a sensitivity of 83%, 100%, and 90% and a specificity of 82%, 100%, and 73% at 0.1, 0.2, and 0.3 mmol/kg, respectively.
Conclusion: A dose of 0.2 mmol/kg of gadodiamide is recommended for reconstruction of rCBV maps if data are acquired with the T2*-weighted protocol described.
Figures
Comment in
-
MR imaging of brain tumors: toward physiologic imaging.AJNR Am J Neuroradiol. 2000 Oct;21(9):1570-1. AJNR Am J Neuroradiol. 2000. PMID: 11039332 Free PMC article. No abstract available.
References
-
- Sartor K. MR Imaging of the Skull and Brain. Heidelberg: Springer; 1992
-
- Mineura K, Sasajima T, Kowada M, et al. Perfusion and metabolism in predicting the survival of patients with cerebral gliomas. Cancer 1994;73:2386-2394 - PubMed
-
- Fink GR. Effects of cerebral angiomas on perifocal and remote tissue: a multivariate positron emission tomography study. Stroke 1992;23:1099-1105 - PubMed
-
- Mineura K, Sasajima T, Itoh Y, et al. Blood flow and metabolism of central neurocytoma: a positron emission tomography study. Cancer 1995;76:1224-1232 - PubMed
Publication types
MeSH terms
Substances
LinkOut - more resources
Full Text Sources
Medical