. 2000 Oct;21(9):1636-44.

Mapping functionally related regions of brain with functional connectivity MR imaging

Affiliations

Mapping functionally related regions of brain with functional connectivity MR imaging

D Cordes et al. AJNR Am J Neuroradiol. 2000 Oct.

Abstract

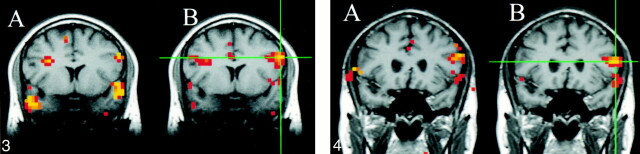
Background and purpose: In subjects who are performing no prescribed cognitive task, functional connectivity mapped with MR imaging (fcMRI) shows regions with synchronous fluctuations of cerebral blood flow. When specific tasks are performed, functional MR imaging (fMRI) can map locations in which regional cerebral blood flow increases synchronously with the performance of the task. We tested the hypothesis that fcMRI maps, based on the synchrony of low-frequency blood flow fluctuations, identify brain regions that show activation on fMRI maps of sensorimotor, visual, language, and auditory tasks.

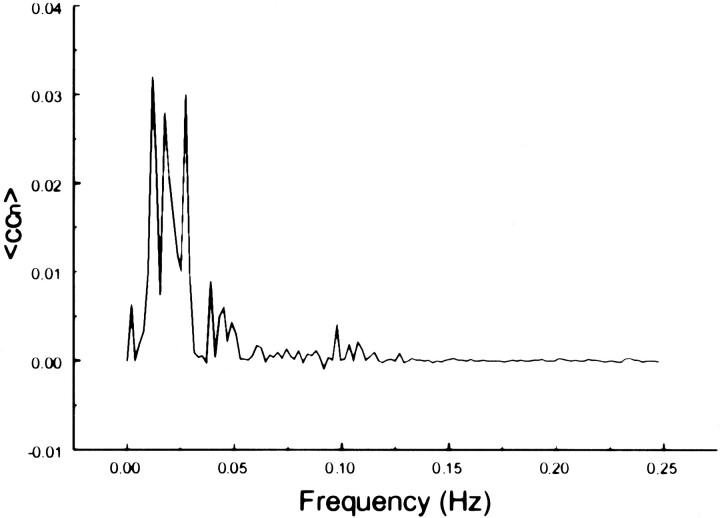
Methods: In four volunteers, task-activation fMRI and functional connectivity (resting-state) fcMRI data were acquired. A small region of interest (in an area that showed maximal task activation) was chosen, and the correlation coefficient of the corresponding resting-state signal with the signal of all other voxels in the resting data set was calculated. The correlation coefficient was decomposed into frequency components and its distribution determined for each fcMRI map. The fcMRI maps were compared with the fMRI maps.

Results: For each task, fcMRI maps based on one to four seed voxel(s) produced clusters of voxels in regions of eloquent cortex. For each fMRI map a closely corresponding fcMRI map was obtained. The frequencies that predominated in the cross-correlation coefficients for the functionally related regions were below 0.1 Hz.

Conclusion: Functionally related brain regions can be identified by means of their synchronous slow fluctuations in signal intensity. Such blood flow synchrony can be detected in sensorimotor areas, expressive and receptive language regions, and the visual cortex by fcMRI. Regions identified by the slow synchronous fluctuations are similar to those activated by motor, language, or visual tasks.


Figures

<sc>fig</sc> 1.
fig 1.
A and B, Selected coronal and axial fMRI maps of voxels activated by the bilateral finger-tapping task (A) and of the voxels functionally connected to a seed voxel (crosshairs) in the sensorimotor cortex in a resting acquisition (B). The sensorimotor cortex is identified on both the fMRI and the fcMRI maps. Voxels within the dentate nucleus of the cerebellum were identified with fMRI but not with the functional connectivity study
<sc>fig</sc> 2.
fig 2.
A and B, Consecutive coronal fMRI maps of voxels activated by a text-listening task (A) and of the voxels functionally connected with a 2 × 2 seed voxel ROI (crosshairs) within the auditory cortex (B). Task activation was evident in the region of the primary and association auditory cortices in the superior temporal lobe. Many of the voxels functionally connected with the seed voxel in the left auditory cortex (crosshairs) have a similar distribution. A few other voxels with lower correlation coefficients (red) were identified outside the auditory cortices. For the connectivity study, data were collected without the patient performing a specific cognitive task
<sc>fig</sc> 2.
fig 2.
fig 3. A and B, A coronal image showing task activation for the text-listening task (A) and connectivity for a seed voxel (crosshairs) in the left frontal lobe in a resting data set (B). The task produces activation in the superior temporal gyral regions bilaterally and in the left frontal lobe in or near Broca's region. Activation is also identified in the right frontal lobe. The voxels with connectivity to the seed voxel (crosshairs) appear to lie in similar locations. fig 4. A and B, Coronal images showing task activation for the word-generation task (A) and connectivity for the left frontal cortex in the region that showed task activation (B). The task produced activation in the left frontal lobe in or near Broca's area and in the superior temporal lobes bilaterally. The voxels with connectivity to the seed voxel (crosshairs) appear to lie in similar locations to the task activation produced by word generation and to the locations with connectivity in figure 3
<sc>fig</sc> 5.
fig 5.
A and B, Consecutive coronal images showing task activation for the visual task (A) and connectivity for the visual cortex (B). The task produces activation in the striate cortex region and in the posterior parietal lobes bilaterally. The voxels with connectivity to the seed voxel (crosshairs) appear to lie in similar locations in the striate cortex region and in the posterior parietal lobe
<sc>fig</sc> 6.
fig 6.
Spectral decomposition of the average correlation coefficient for interregional connectivity in the motor cortex (same subject as in fig 1). Only frequency components between 0 and 0.05 Hz contribute significantly to the correlation coefficient
<sc>fig</sc> 7.
fig 7.
Spectral decomposition of the average correlation coefficient for interregional connectivity in the auditory cortex (same subject as in fig 2). Only frequency components less than 0.05 Hz contribute significantly to the correlation coefficient
<sc>fig</sc> 8.
fig 8.
Spectral decomposition of the average correlation coefficient for interregional connectivity in the prefrontal cortex (same subject as in fig 3). Only the same low frequency components contribute significantly to the correlation coefficient
<sc>fig</sc> 9.
fig 9.
Spectral decomposition of the average correlation coefficient for interregional connectivity in the prefrontal cortex (same subject as in fig 4). Only the same low-frequency components contribute significantly to the correlation coefficient
<sc>fig</sc> 10.
fig 10.
Spectral decomposition of the average correlation coefficient for interregional connectivity in the visual cortex (same subject as in fig 5). Only low-frequency components contribute significantly to the correlation coefficient
<sc>fig</sc> 11.
fig 11.
Spectral decomposition of the average correlation coefficient from a seed voxel in the left jugular vein. Note the relative paucity of frequencies in the 0 to 0.05 Hz range, the spread over many frequencies, and the peak at 0.2 Hz
<sc>fig</sc> 12.
fig 12.
Spectral decomposition of the average correlation coefficient using a seed voxel in the right middle cerebral artery. Low frequencies do not predominate. Peaks are present at multiple frequencies above 0.05 Hz
<sc>fig</sc> 13.
fig 13.
Spectral decomposition of the average correlation coefficient using a seed voxel in the left ventricle. Frequencies from 0.025 to 0.075 predominate. Since no BOLD effect can be invoked in CSF, these frequencies represent likely aliased cardiac cycle effects

References

    1. Haughton VM, Biswal B. Clinical application of basal regional cerebral blood flow fluctuation measurements by FMRI. In: Hudetz A, Bruley D, eds: Oxygen Transport to Tissue. New York: Plenum 1998;:583-590 - PubMed
    1. Hudetz AG. Blood flow in the cerebral capillary network: a review emphasizing observations with intravital microscopy. Microcirculation 1997;4:233-252 - PubMed
    1. Dora E, Kovach AGB. Metabolic and vascular volume oscillation in the cat brain cortex. Acta Physiol Hung 1980;57:261-275 - PubMed
    1. Fasano VA, Urciuoli R, Bolognese P, Mostert M. Introperative use of laser Doppler in the study of cerebral microvascular circulation. Acta Neurochir (Wien) 1988;95:40-48 - PubMed
    1. Gray CM, Konig P, Engel AK, Singer W. Oscillatory responses in cat visual cortex exhibit inter-columnar synchronization which reflects global stimulus properties. Nature 1989;338:334-337 - PubMed