

Time dependent variability of QT dispersion after acute myocardial infarction and its relation to ventricular fibrillation: a prospective study
- PMID: 11040010
- PMCID: PMC1729488
- DOI: 10.1136/heart.84.5.504
Time dependent variability of QT dispersion after acute myocardial infarction and its relation to ventricular fibrillation: a prospective study
Abstract
Objective: To show whether increased QT dispersion on admission predicts ventricular fibrillation after acute myocardial infarction, and to determine the nature of time related changes in QT dispersion.
Design: Prospective cohort study.
Setting: Coronary care units of three teaching hospitals in Newcastle-upon-Tyne over an eight month period.
Patients: All had acute myocardial infarction according to World Health Organization criteria.
Interventions: For all patients, QT dispersion (QTd) and Bazett rate corrected QTc dispersion (QTcd) were measured from a high quality 12 lead ECG recorded on admission at a paper speed of 50 mm/s. In a subset, serial ECGs were recorded regularly to show time related changes in QTcd following acute myocardial infarction.
Main outcome measures: Occurrence of ventricular fibrillation within the first 24 hours after myocardial infarction.
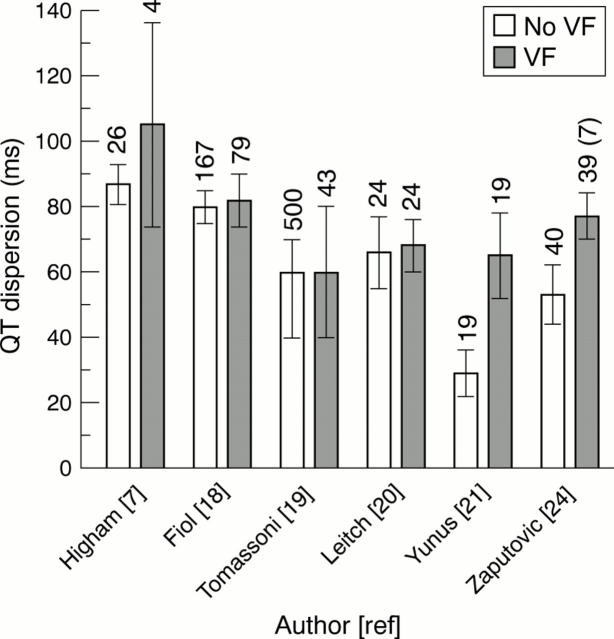
Results: Data collected from 201 patients, 12 of whom (6%) developed ventricular fibrillation within 24 hours. Neither QTd nor QTcd differed between those developing ventricular fibrillation and those who did not: QTd mean (SD), 74 (24) ms (95% confidence interval (CI) 59 to 89) v 66 (24) ms (95% CI 62 to 70), respectively; QTcd, 86 (26) ms(0.5) (95% CI 70 to 102) v 77 (29) ms(0.5) (95% CI 72 to 82), respectively. Significant QTcd changes occurred early after myocardial infarction.
Conclusions: Admission QTd and QTcd do not predict ventricular fibrillation after acute myocardial infarction. There are significant changes in QTcd with time, which may account for this measured lack of correlation.
Figures


Similar articles
-
Relationship between QT dispersion and the incidence of early ventricular arrhythmias in patients with acute myocardial infarction.Int J Cardiol. 1997 Dec 19;62(3):211-6. doi: 10.1016/s0167-5273(97)00226-x. Int J Cardiol. 1997. PMID: 9476680 Clinical Trial.
-
What is the optimal evaluation time of the QT dispersion after acute myocardial infarction for the risk stratification?Angiology. 2001 Jul;52(7):463-8. doi: 10.1177/000331970105200704. Angiology. 2001. PMID: 11515985 Clinical Trial.
-
Correlation between dispersion of repolarization (QT dispersion) and ventricular ectopic beat frequency in patients with acute myocardial infarction: a marker for risk of arrhythmogenesis?Int J Cardiol. 2004 Jan;93(1):69-73. doi: 10.1016/s0167-5273(03)00127-x. Int J Cardiol. 2004. PMID: 14729438
-
The Effect of Percutaneous Coronary Intervention on QT Dispersion and the Association Between Them: A Systematic Review.Cureus. 2023 Mar 16;15(3):e36226. doi: 10.7759/cureus.36226. eCollection 2023 Mar. Cureus. 2023. PMID: 37065409 Free PMC article. Review.
-
Relation Between Familial Mediterranean Fever and QT Markers (QTc, QTd, and QTcd): A Systematic Review and Meta-Analysis.Cureus. 2022 Oct 22;14(10):e30585. doi: 10.7759/cureus.30585. eCollection 2022 Oct. Cureus. 2022. PMID: 36420231 Free PMC article. Review.
Cited by
-
Is QT dispersion associated with sudden cardiac death in patients with hypertrophic cardiomyopathy?Ann Noninvasive Electrocardiol. 2001 Jul;6(3):209-15. doi: 10.1111/j.1542-474x.2001.tb00110.x. Ann Noninvasive Electrocardiol. 2001. PMID: 11466139 Free PMC article.
-
Atypical antipsychotics: from potassium channels to torsade de pointes and sudden death.Drug Saf. 2005;28(1):35-51. doi: 10.2165/00002018-200528010-00003. Drug Saf. 2005. PMID: 15649104 Review.
References
Publication types
MeSH terms
LinkOut - more resources
Full Text Sources
Medical