Comparative Study
. 2000 Oct 15;14(20):2635-49.
doi: 10.1101/gad.844200.

High-resolution localization of Drosophila Spt5 and Spt6 at heat shock genes in vivo: roles in promoter proximal pausing and transcription elongation

Affiliations
Comparative Study

High-resolution localization of Drosophila Spt5 and Spt6 at heat shock genes in vivo: roles in promoter proximal pausing and transcription elongation

E D Andrulis et al. Genes Dev. .

Abstract

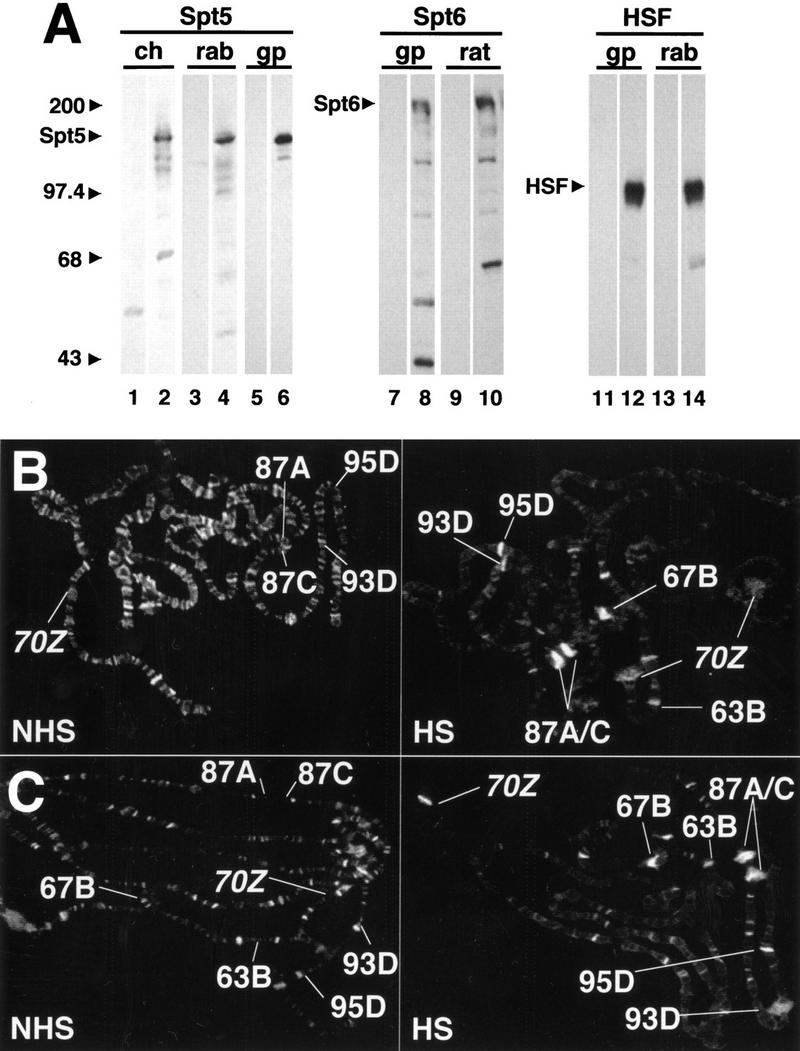
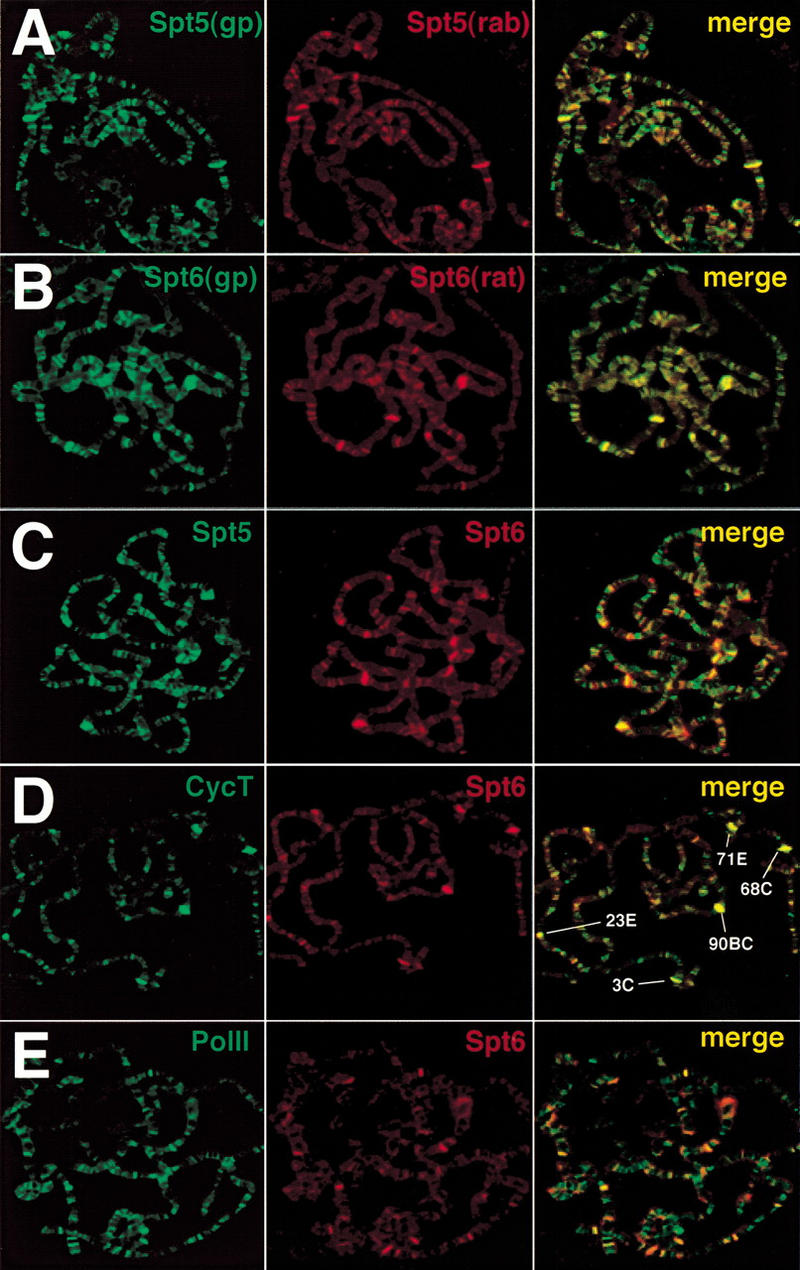
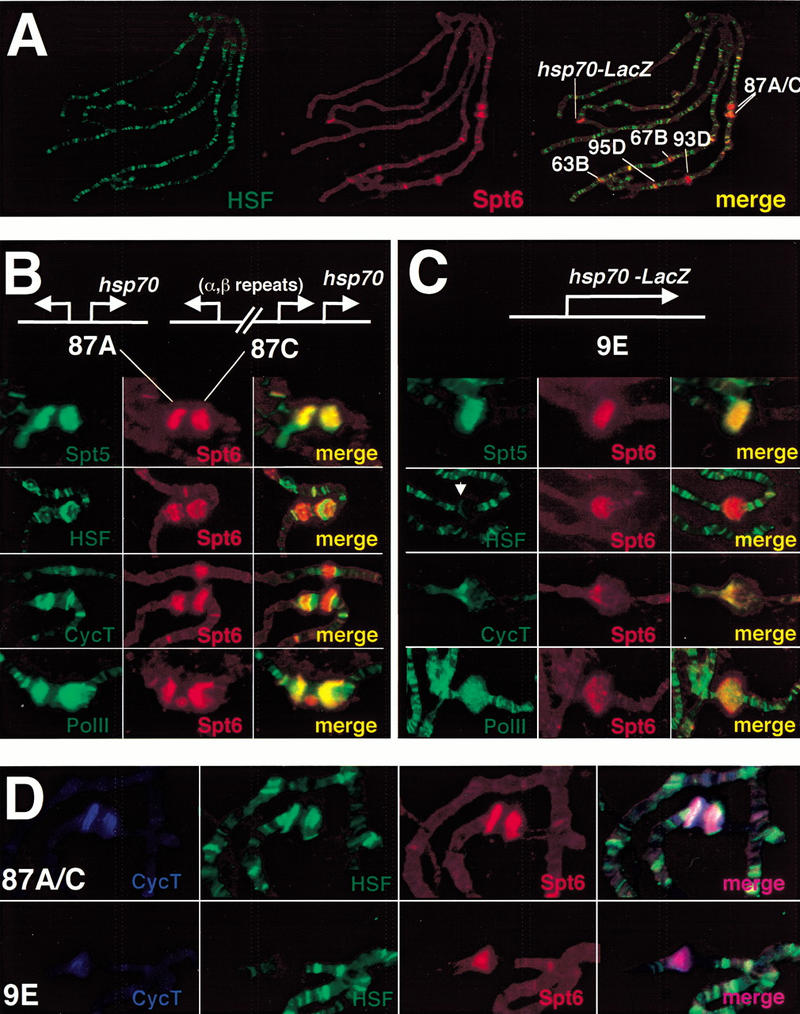
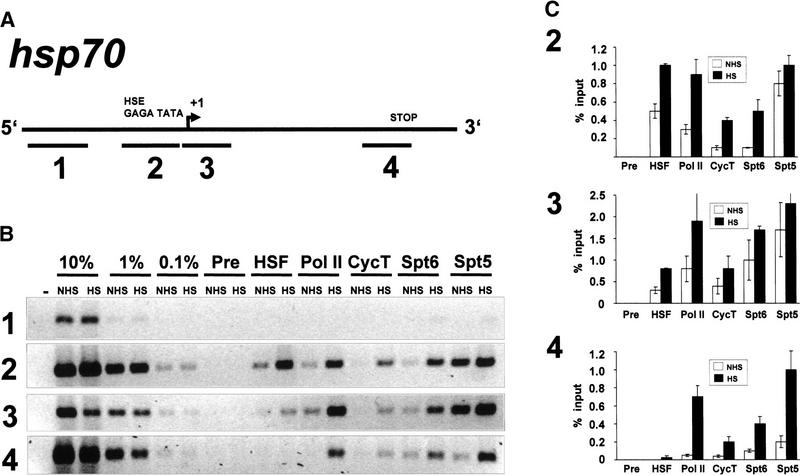
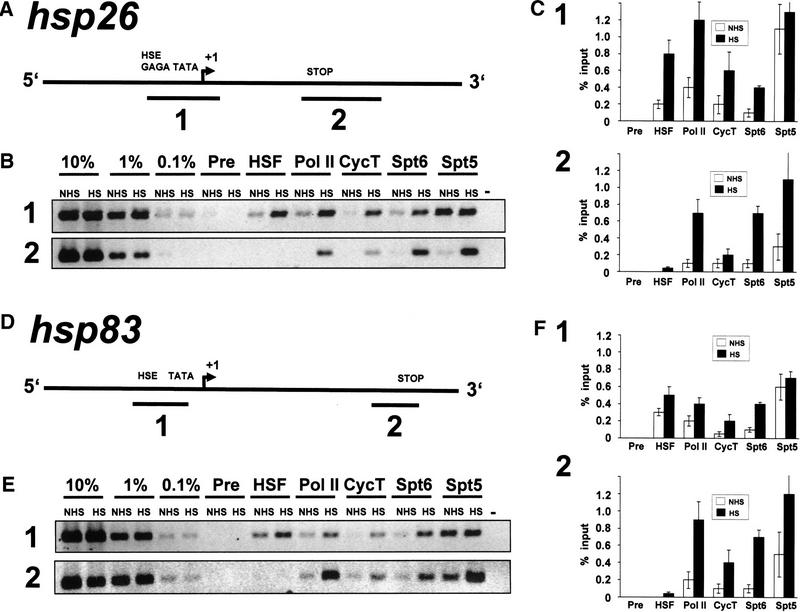
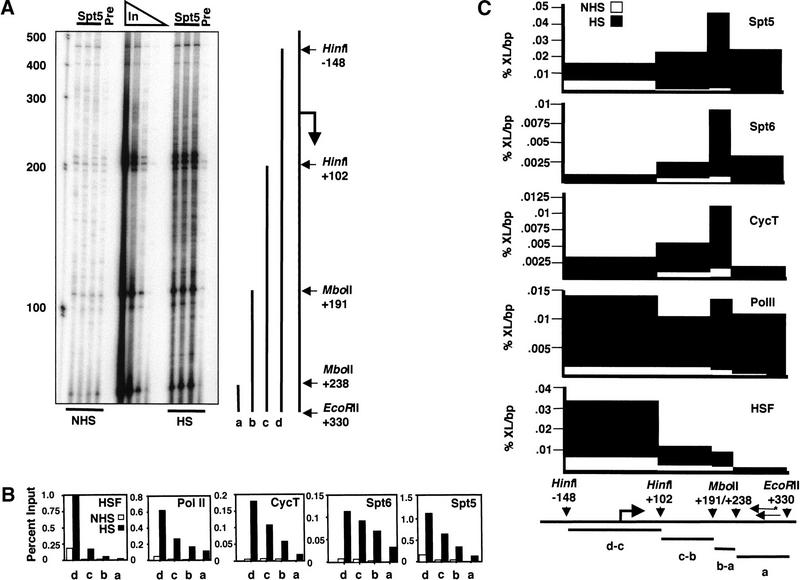
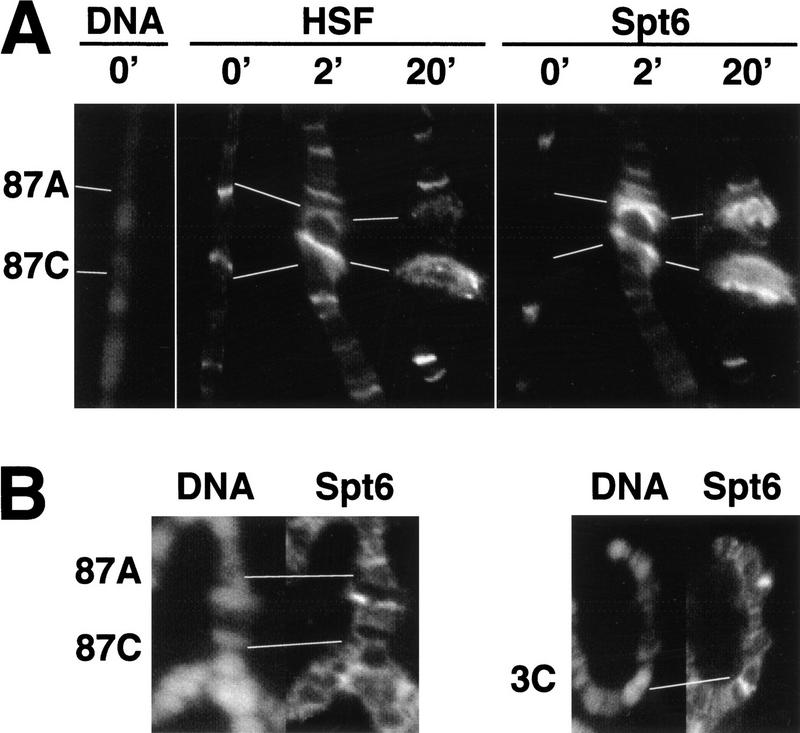
Recent studies have demonstrated roles for Spt4, Spt5, and Spt6 in the regulation of transcriptional elongation in both yeast and humans. Here, we show that Drosophila Spt5 and Spt6 colocalize at a large number of transcriptionally active chromosomal sites on polytene chromosomes and are rapidly recruited to endogenous and transgenic heat shock loci upon heat shock. Costaining with antibodies to Spt6 and to either the largest subunit of RNA polymerase II or cyclin T, a subunit of the elongation factor P-TEFb, reveals that all three factors have a similar distribution at sites of active transcription. Crosslinking and immunoprecipitation experiments show that Spt5 is present at uninduced heat shock gene promoters, and that upon heat shock, Spt5 and Spt6 associate with the 5' and 3' ends of heat shock genes. Spt6 is recruited within 2 minutes of a heat shock, similar to heat shock factor (HSF); moreover, this recruitment is dependent on HSF. These findings provide support for the roles of Spt5 in promoter-associated pausing and of Spt5 and Spt6 in transcriptional elongation in vivo.


Figures

Figure 1
Figure 1
Spt5 and Spt6 are recruited to heat shock puffs on Drosophila polytene chromosomes. (A) Western blot analyses of Spt5, Spt6, and HSF antibodies. Proteins from Drosophila Kc cells were separated on an 8% polyacrylamide gel and transferred to nitrocellulose. Blots were probed with antiserum (even lanes) or with preimmune serum (odd lanes) at a dilution of 1 : 1000. Appropriate secondary antibodies were used and bands visualized using ECL (Amersham). Aligned nitrocellulose strips for each antibody are from the same transferred gels. (Ch) chicken; (rab) rabbit; (gp) guinea pig; (rat) rat. (B,C) Staining of non–heat shock (NHS) and heat shock (HS) polytene chromosomes with rabbit α-Spt5 (B) or guinea pig α-Spt6 (C) antibodies. Major, endogenous heat shock loci (87A, 87C, 63B, 67B, 93D, and 95D) as well as the transgenic sites (hsp70–LacZ [70Z]) are defined. Note the redistribution of Spt5 and Spt6 on heat shock. The staining pattern of both Spt5 and Spt6 is quite similar to that seen previously with cyclin T (Lis et al. 2000).
Figure 2
Figure 2
Global immunofluorescence analysis of Spt5 and Spt6 on polytene chromosomes under non–heat shock conditions. (A) Costaining with different Spt5 antibodies. (Rab) Rabbit; (gp) guinea pig. (B) Costaining with different Spt6 antibodies. (C) Costaining with Spt5 (rab) and Spt6 (gp) antibodies. (D) Costaining with Spt6 (gp) and cyclin T (rab) antibodies. (E) Costaining with Spt6 (gp) and Pol II (rab) antibodies. Overlap of the green and red stains appear in the merge as yellow, yellow-green, and orange.
Figure 3
Figure 3
Global and high-resolution analysis of Spt6 at native and transgenic heat shock puffs. (A) Comparative immunofluorescence of Spt6 (rat) and HSF (rabbit) under heat shock conditions. Spt6 is recruited to heat shock loci but not to all sites of HSF localization. (B,C) High-resolution study of Spt6 distribution in comparison to that of HSF, cyclin T, and Pol II. Maps of the native heat shock loci 87A and 87C and the hsp70–LacZ transgene are shown. HSF and cyclin T resolve from Spt6 at both the native and transgenic heat shock loci. At the transgene, these antibodies stain the locus in a region that would be consistent with promoter and 5′ sequences. Note the HSF staining pattern (white arrow). The site above 87A and 87C in the cyclin T and Spt6 costain is the heat shock locus 67B. Spt6 and Pol II show almost complete overlap within the heat shock puffs. (D) Triple label with cyclin T, HSF, and Spt6.
Figure 4
Figure 4
Crosslinking and immunoprecipitation of Spt5 and Spt6 at hsp70. (A) Schematic representation of hsp70 and the PCR-amplified fragments representing the upstream region (1), the promoter (2), the 5′ end (3), and the 3′ end (4) of hsp70. The promoter elements, transcription start site, and stop are labeled but not drawn to scale. (B) PCR analysis of crosslinked and immunoprecipitated DNA on ethidium bromide (EtBr)-stained 2% agarose gels. PCR reactions using 10%, 1%, and 0.1% of input DNAs are loaded to determine the linear range of signal. NHS, non–heat shock; (HS) heat shock; (Pre) preimmune serum; (−) no DNA. (C) Quantitative analysis of EtBr-stained bands for PCR analysis. Values on the abscissa represent the amount immunoprecipitated as a percentage of total input DNA. Experiments were performed in triplicate, and standard deviations are shown. Note different scale for bar graph of fragment 3 immunoprecipitates.
Figure 5
Figure 5
Crosslinking and immunoprecipitation of Spt5 and Spt6 at hsp26 and hsp83. (A,D) Schematic representations of hsp26 and hsp83 and the PCR-amplified fragments representing the promoter (1) and the 3′ end (2). (B,E) PCR analysis of crosslinked and immunoprecipitated DNA on EtBr-stained 2% agarose gels of hsp26 (B) and hsp83 (E). (C,F) Quantitative analysis of EtBr-stained bands for PCR analysis of hsp26 (C) and hsp83 (F). Experiments were performed in triplicate, and standard deviations are shown. (NHS) non–heat shock; (HS) heat shock; (Pre) preimmune serum; (−) no DNA.
Figure 6
Figure 6
High-resolution determination of protein occupancy on hsp70. (A) Ligation-mediated PCR analysis on hsp70. hsp70 restriction endonuclease sites and fragments created by partial digestion at HinfI, and MboII sites are shown to right of the gel, and these define one end of the region analyzed: EcoRII was used to cut the DNA to completion and thereby define the other end of the region analyzed. The fragments produced by this digest are shown: a, b, c, and d. The complete analysis, starting with the immunoprecipitation step, was performed in triplicate, and the different samples show very good agreement for all bands that were quantified. “Pre” is an immunoprecipitation performed with a preimmune serum control. (B) Determination of amount of hsp70 DNA immunoprecipitated relative to input DNA. Bands were quantified, and background signals from the preimmune controls were subtracted in each case. The percentage of the total sample that is immunoprecipitated for each of the four fragments is plotted. The triplet shown at HinfI +102 (see A) results from small-length polymorphisms among the hsp70 genes, and the signal from the entire triplet was used to quantify this fragment. Note that HSF and Pol II antibodies coimmunoprecipitate more DNA than do Spt6 and cyclin T antibodies (note the different scales for the abscissae). (C) Determination of protein density on hsp70. The densities were calculated from the measurements in part B. The densities from each interval were derived from subtraction of the next shortest fragment (except for a, which is the shortest), and then dividing by the length of the DNA interval. Note the different scales for the abscissae. (%XL) Percentage crosslinked immunoprecipitated DNA relative to input; (bp) base pair; (*) 32P end-label.
Figure 7
Figure 7
Kinetics of recruitment of Spt6 to heat shock loci. (A) Spt6 recruitment at major heat shock loci 87A and 87C on untreated (0′) polytene chromosomes or on 2- and 20-min heat shock–treated chromosomes. A DNA Hoechst stain is shown for the uninduced sample to allow mapping of the non-puffed heat shock loci. (B) Recruitment of Spt6 to heat shock loci on polytene chromosomes in hsf4 mutant. Shown are the 87A and 87C heat shock loci (left) and the developmentally active locus at 3C (right) after a 20-min heat shock within the same polytene chromosome spread. 87A and 87C display little or no staining with Spt6 antibody, whereas Spt6 staining at the developmentally active locus at 3C persists.

Similar articles

Cited by

References

    1. Adams MD, Celniker SE, et al. The genome sequence of Drosophila melanogaster. Science. 2000;287:2185–2195. - PubMed
    1. Bortvin A, Winston F. Evidence that Spt6p controls chromatin structure by a direct interaction with histones. Science. 1996;272:1473–1476. - PubMed
    1. Dahmus ME. The role of multisite phosphorylation in the regulation of RNA polymerase II activity. Prog Nucleic Acid Res and Mol Biol. 1994;48:143–179. - PubMed
    1. Gilmour DS, Lis JT. RNA polymerase II interacts with the promoter region of the noninduced hsp-70 gene in Drosophila melanogaster cells. Mol Cell Biol. 1986;6:3984–3989. - PMC - PubMed
    1. Guzman E, Lis JT. Transcription factor TFIIH is required for promoter melting in vivo. Mol Cell Biol. 1999;19:5652–5658. - PMC - PubMed

Publication types

MeSH terms

Substances