

SNP profile within the human major histocompatibility complex reveals an extreme and interrupted level of nucleotide diversity
- PMID: 11042155
- PMCID: PMC310975
- DOI: 10.1101/gr.127200
SNP profile within the human major histocompatibility complex reveals an extreme and interrupted level of nucleotide diversity
Abstract
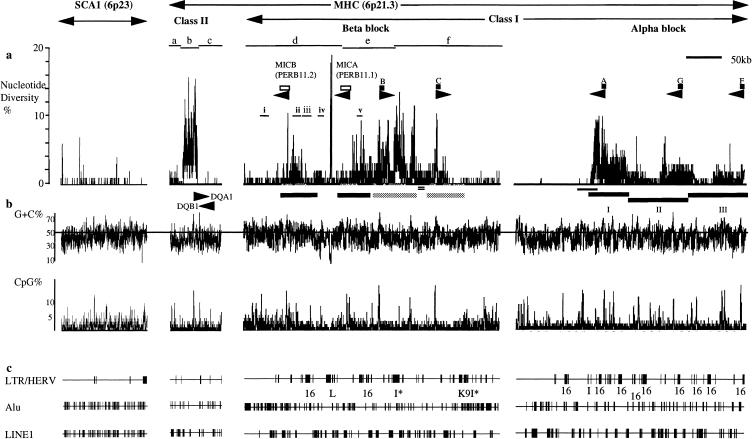
The human major histocompatibility complex (MHC) is characterized by polymorphic multicopy gene families, such as HLA and MIC (PERB11); duplications; insertions and deletions (indels); and uneven rates of recombination. Polymorphisms at the antigen recognition sites of the HLA class I and II genes and at associated neutral sites have been attributed to balancing selection and a hitchhiking effect, respectively. We, and others, have previously shown that nucleotide diversity between MHC haplotypes at non-HLA sites is unusually high (>10%) and up to several times greater than elsewhere in the genome (0.08%-0.2%). We report here the most extensive analysis of nucleotide diversity within a continuous sequence in the genome. We constructed a single nucleotide polymorphism (SNP) profile that reveals a pattern of extreme but interrupted levels of nucleotide diversity by comparing a continuous sequence within haplotypes in three genomic subregions of the MHC. A comparison of several haplotypes within one of the genomic subregions containing the HLA-B and -C loci suggests that positive selection is operating over the whole subgenomic region, including HLA and non-HLA genes. [The sequence data for the multiple haplotype comparisons within the class I region have been submitted to DDBJ/EMBL/GenBank under accession nos. AF029061, AF029062, and AB031005-AB031010. Additional sequence data have been submitted to the DDBJ data library under accession nos. AB031005-AB03101 and AF029061-AF029062.]
Figures
Similar articles
-
Toward understanding MHC disease associations: partial resequencing of 46 distinct HLA haplotypes.Genomics. 2006 May;87(5):561-71. doi: 10.1016/j.ygeno.2005.11.020. Epub 2006 Jan 23. Genomics. 2006. PMID: 16434165
-
Conserved extended haplotypes of the major histocompatibility complex: further characterization.Genes Immun. 2006 Sep;7(6):450-67. doi: 10.1038/sj.gene.6364315. Epub 2006 Jun 22. Genes Immun. 2006. PMID: 16791278
-
Variation and linkage disequilibrium within odorant receptor gene clusters linked to the human major histocompatibility complex.Hum Immunol. 2010 Sep;71(9):843-50. doi: 10.1016/j.humimm.2010.06.011. Epub 2010 Jun 12. Hum Immunol. 2010. PMID: 20547194
-
[Human histocompatibility HLA system. Considerations in the light of current concepts. VIII. Polymorphism of HLA-related MIC system].Przegl Lek. 2001;58(12):1076-8. Przegl Lek. 2001. PMID: 12041026 Review. Polish.
-
A genomic perspective on HLA evolution.Immunogenetics. 2018 Jan;70(1):5-27. doi: 10.1007/s00251-017-1017-3. Epub 2017 Jul 7. Immunogenetics. 2018. PMID: 28687858 Free PMC article. Review.
Cited by
-
HLA DNA sequence variation among human populations: molecular signatures of demographic and selective events.PLoS One. 2011 Feb 1;6(2):e14643. doi: 10.1371/journal.pone.0014643. PLoS One. 2011. PMID: 21408106 Free PMC article.
-
Association of SNP variants of MHC Class II DRB gene with thermo-physiological traits in tropical goats.Trop Anim Health Prod. 2017 Feb;49(2):323-336. doi: 10.1007/s11250-016-1196-1. Epub 2016 Dec 1. Trop Anim Health Prod. 2017. PMID: 27909914
-
MHC class I of saltwater crocodiles (Crocodylus porosus): polymorphism and balancing selection.Immunogenetics. 2012 Nov;64(11):825-38. doi: 10.1007/s00251-012-0637-x. Epub 2012 Aug 5. Immunogenetics. 2012. PMID: 22864956
-
MHC class II β exon 2 variation in pardalotes (Pardalotidae) is shaped by selection, recombination and gene conversion.Immunogenetics. 2017 Feb;69(2):101-111. doi: 10.1007/s00251-016-0953-7. Epub 2016 Oct 8. Immunogenetics. 2017. PMID: 27717988
-
Ancient haplotypes of the HLA Class II region.Genome Res. 2005 Sep;15(9):1250-7. doi: 10.1101/gr.3554305. Genome Res. 2005. PMID: 16140993 Free PMC article.
References
-
- Abraham LJ, Grimsley G, Leelayuwat C, Townend DC, Pinelli M, Christiansen FT, Dawkins RL. A region centromeric of the major histocompatibility complex class I region is as highly polymorphic as HLA-B. Implications for recombination. Hum Immunol. 1993;38:75–82. - PubMed
-
- Aquadro CF. Why is the genome variable? Insights from Drosophila. Trends Genet. 1992;8:355–362. - PubMed
-
- Bauer S, Groh V, Wu J, Steinle A, Phillips JH, Lanier LL, Spies T. Activation of NK cells and T cells by NKG2D, a receptor for stress-inducible MICA. Science. 1999;285:727–729. - PubMed
-
- Dawkins RL, Leelayuwat C, Gaudieri S, Tay GK, Hui J, Cattley S, Martinez P, Kulski JK. Genomics of the Major Histocompatibility Complex: Haplotypes, duplications, retroviruses and disease. Immunol Rev. 1999;167:275–304. - PubMed
-
- Degli-Esposti MA, Leaver AL, Christiansen FT, Witt CS, Abraham LJ, Dawkins RL. Ancestral haplotypes: Conserved population MHC haplotypes. Hum Immunol. 1992;34:242–252. - PubMed
Publication types
MeSH terms
Substances
Associated data
- Actions
- Actions
- Actions
- Actions
- Actions
- Actions
- Actions
- Actions
LinkOut - more resources
Full Text Sources
Other Literature Sources
Research Materials