. 2000 Nov;74(22):10293-303.
doi: 10.1128/jvi.74.22.10293-10303.2000.

Selection of optimal polypurine tract region sequences during Moloney murine leukemia virus replication

Affiliations

Selection of optimal polypurine tract region sequences during Moloney murine leukemia virus replication

N D Robson et al. J Virol. 2000 Nov.

Abstract

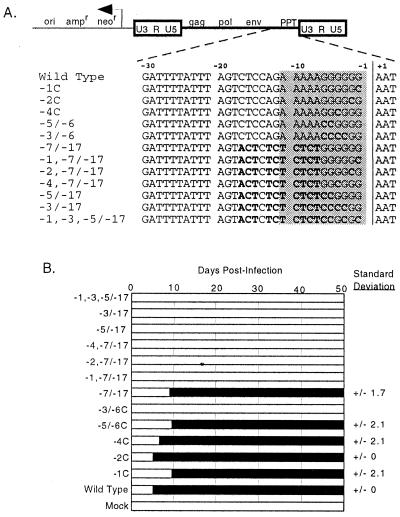
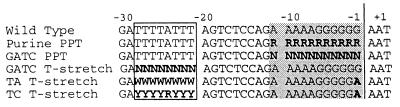
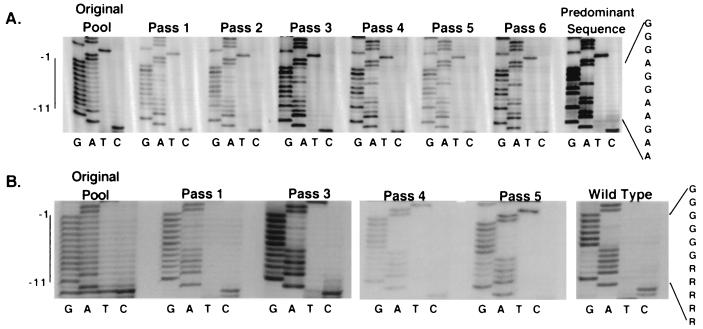
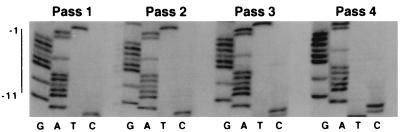
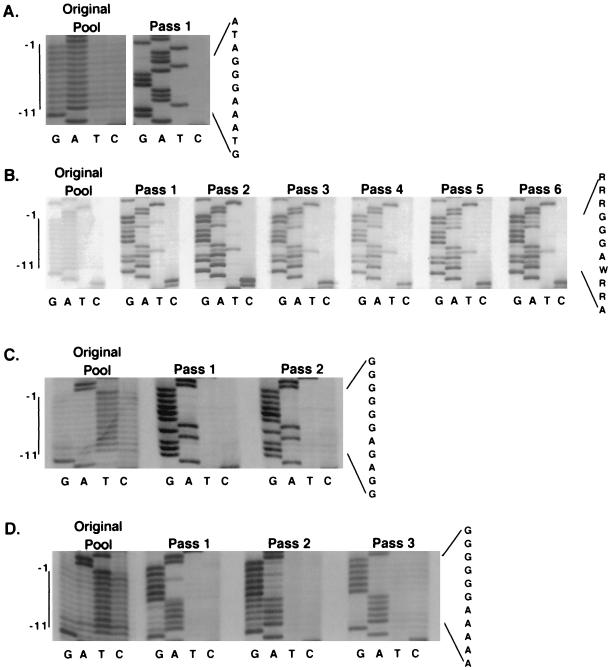
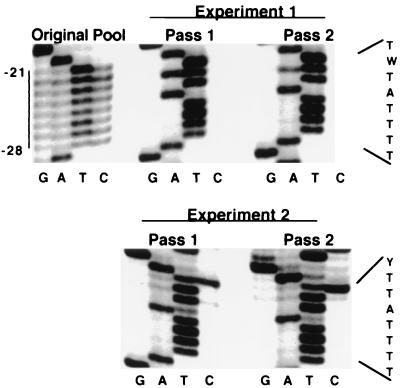
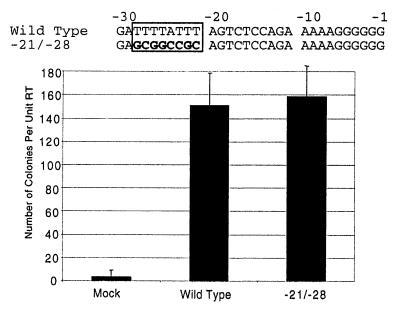
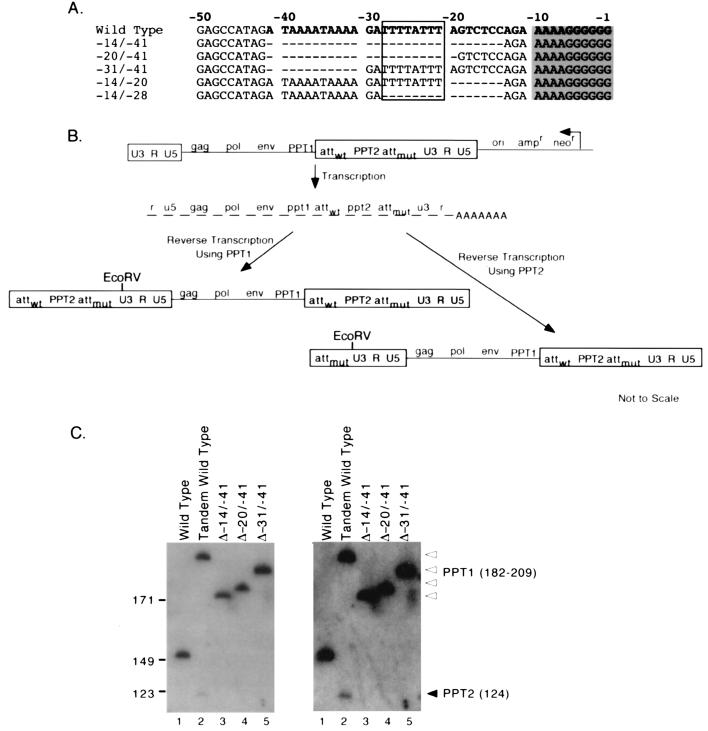
Retrovirus plus-strand synthesis is primed by a cleavage remnant of the polypurine tract (PPT) region of viral RNA. In this study, we tested replication properties for Moloney murine leukemia viruses with targeted mutations in the PPT and in conserved sequences upstream, as well as for pools of mutants with randomized sequences in these regions. The importance of maintaining some purine residues within the PPT was indicated both by examining the evolution of random PPT pools and from the replication properties of targeted mutants. Although many different PPT sequences could support efficient replication and one mutant that contained two differences in the core PPT was found to replicate as well as the wild type, some sequences in the core PPT clearly conferred advantages over others. Contributions of sequences upstream of the core PPT were examined with deletion mutants. A conserved T-stretch within the upstream sequence was examined in detail and found to be unimportant to helper functions. Evolution of virus pools containing randomized T-stretch sequences demonstrated marked preference for the wild-type sequence in six of its eight positions. These findings demonstrate that maintenance of the T-rich element is more important to viral replication than is maintenance of the core PPT.


Figures

FIG. 1
FIG. 1
Targeted 3′ untranslated region mutations. (A) The mutations. Shown at the top is the structure of the pMLV-neo proviral plasmid. Dashed lines indicate the position of sequences shown below. For mutants, differences from wild type are boldfaced. The core PPT is shaded. The vertical line indicates the PPT/U3 boundary and the normal site of plus-strand primer cleavage. (B) Replication efficiency of mutants. The leftmost edge of the black bars indicates the time point at which virus spread was first detected. Standard deviations, in days, of time points when replication was detected are shown at the right for those mutants that replicated.
FIG. 2
FIG. 2
Composition of degenerate pools. Boldface lettering indicates positions that differed from wild type. R indicates any purine, W indicates T or A, Y indicates any pyrimidine, and N indicates any nucleotide. The core PPT is shaded, and the T stretch is boxed. The vertical line indicates the site of wild-type plus-strand primer cleavage.
FIG. 3
FIG. 3
Evolution of randomized purine PPT pools. (A) Evolution of 179-member pool. Direct sequencing of uncloned PCR products containing the PPT region amplified from pools of unintegrated viral DNAs harvested from Rat2 cells infected with pool virus or of plasmid PCR products. At the left is the sequence of a PCR product of the original purine PPT plasmid pool, with the position of the core PPT indicated. Sequences of six successive passages of the pool are then shown. The sequencing reaction on the right is of a PCR product from a plasmid clone containing the predominant sequence that emerged after serial passage. At the far right is the predominant sequence. (B) Evolution of ∼6,300-member purine PPT pool. The original plasmid pool is on the left. Sequences of PCR products from viral DNA after passages 1, 3, 4, and 5 are shown, followed by the sequence of a wild-type PCR product. The predominant sequence is shown at the right.
FIG. 4
FIG. 4
Competition between the wild-type sequence and the 179-member purine PPT pool predominant sequence. The predominant sequence differed from the wild-type sequence at positions −4 and −9. Sequences of PCR-amplified PPT regions of unintegrated viral DNA harvested from Rat2 cells infected with competition virus from passages 1 through 4 were determined. The position of the core PPT is indicated on the left.
FIG. 5
FIG. 5
Evolution of the GATC PPT pools. Sequences of PCR-amplified PPT regions of unintegrated viral DNA harvested from Rat2 cells infected with GATC PPT pool virus and of PCR products of the original plasmid pools were determined. (A) Evolution of a subset of the 530-member GATC PPT pool. The original GATC PPT plasmid pool is shown on the left. Sequencing of the pool after a single passage is shown on the right. On the far right is the predominant sequence after passage. At the far left, the position of the core PPT is indicated. (B) Evolution of the complete 530-member GATC pool. On the left is this GATC PPT plasmid pool. Six passages of the pool are then shown. The predominant sequence postpassage is shown at the right. (C) Evolution of the 4,000-member GATC pool. On the left is this GATC PPT plasmid pool before transfection. Two passages of the pool are then shown. Shown on the right is the predominant sequence after passage. (D) Evolution of the 5,000-member GATC pool. On the left is this pool before transfection. Three passages of the pool are shown. Shown on the right is the predominant postpassage sequence.
FIG. 6
FIG. 6
Evolution of T-stretch pools. Results from two independent evolution experiments performed with subsets of the 7,000-member T-stretch pool are presented. At the left in the first row is the sequence of the T-stretch plasmid pool before transfection, with the position of the T stretch indicated. Two successive passages for each of two evolution experiments are shown. Shown at the right is the predominant sequence that emerged in each experiment.
FIG. 7
FIG. 7
Effect of the −21/−28 T-stretch on helper functions. Sequences of the wild type and mutant are compared at the top. The T stretch is boxed in black, and differences from wild type are shown in boldface Ψ proviral clones containing a wild-type T stretch or the −21/−28 mutation were cotransfected with a puromycin resistance-conferring retroviral vector. Virus was collected, quantified by RT activity, and used to infect NIH 3T3 cells. Shown is the average number of puromycin-resistant colonies per unit of RT for three independent experiments.
FIG. 8
FIG. 8
Effects of deletions upstream of the core PPT. (A) Deletions introduced upstream of the core PPT. Nucleotides shown in boldface are the same in both PPT1 and PPT2 of the wild-type tandem PPT construct. Dashes indicate position of deletions. When deletions were placed in tandem PPT constructs, they were introduced into PPT2. The core PPT is shaded, and the T stretch is boxed. (B) Schematic representation of the structure and predicted products of the tandem PPT construct. The second PPT inserted in U3 (PPT2) and mutated att (attmut) are shown. The first line indicates the structure of the transfected proviral construct. Boxed regions indicate LTRs. The structural organization of the encapsidated RNAs is indicated on the second line. The final two lines indicate the predicted structures of the reverse transcription products; the single RNA species on the second line generates two different DNA products that differ in their upstream LTRs. The EcoRV site used to generate end products for Southern blots is shown. Note that deletions introduced into PPT2 will alter the sizes of the reverse transcription product that result from PPT1 use but that products which result when PPT2 primes plus-strand synthesis will be the same size for all deletion mutants and for wild type. Drawings are not to scale. (C) Southern blot of EcoRV-digested nonintegrated viral DNA products. Marker (left) and product (right) lengths are indicated in base pairs. PPT1 bands are indicated with open arrowheads, and the PPT2 band is indicated with a filled arrowhead. PPT1 product sizes are as follows: 209 bp for wild-type tandem PPT1 products, 199 bp for Δ−31/−41, 188 bp for Δ−20/−41, and 182 bp for Δ−14/−41. PPT2 products are 124 bp for all constructs. The wild-type (single PPT) product is 144 bp. The panel on the right is a darker exposure of the one at the left.

References

    1. Bacharach E, Gonsky J, Lim D, Goff S P. Deletion of a short, untranslated region adjacent to the polypurine tract in Moloney murine leukemia virus leads to formation of aberrant 5′ plus-strand DNA ends in vivo. J Virol. 2000;74:4755–4764. - PMC - PubMed
    1. Champoux J J. Roles of ribonuclease H in reverse transcription. In: Skalka A M, Goff S P, editors. Reverse transcriptase. Cold Spring Harbor, N.Y: Cold Spring Harbor Laboratory; 1993. pp. 103–117.
    1. Fedoroff O Y, Ge Y, Reid B R. Solution structure of r(gaggacug):d(CAGTCCTC) hybrid: implications for the initiation of HIV-1 (+)-strand synthesis. J Mol Biol. 1997;269:225–239. - PubMed
    1. Gao H-Q, Boyer P L, Arnold E, Hughes S H. Effects of mutations in the polymerase domain on the polymerase, RNase H and strand transfer activities of human immunodeficiency virus type 1 reverse transcriptase. J Mol Biol. 1998;277:559–572. - PubMed
    1. Gao H-Q, Sarafianos S G, Arnold E, Hughes S H. Similarities and differences in the RNaseH activities of human immunodeficiecy virus type 1 reverse transcriptase and Moloney murine leukemia virus reverse transcriptase. J Mol Biol. 1999;294:1097–1113. - PubMed

Publication types

LinkOut - more resources