. 2000 Nov;74(22):10752-65.
doi: 10.1128/jvi.74.22.10752-10765.2000.

Testing the hypothesis of a recombinant origin of human immunodeficiency virus type 1 subtype E

Affiliations

Testing the hypothesis of a recombinant origin of human immunodeficiency virus type 1 subtype E

J P Anderson et al. J Virol. 2000 Nov.

Abstract

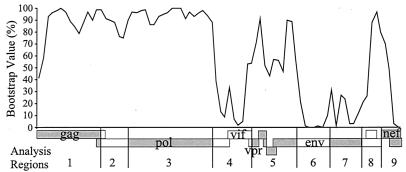
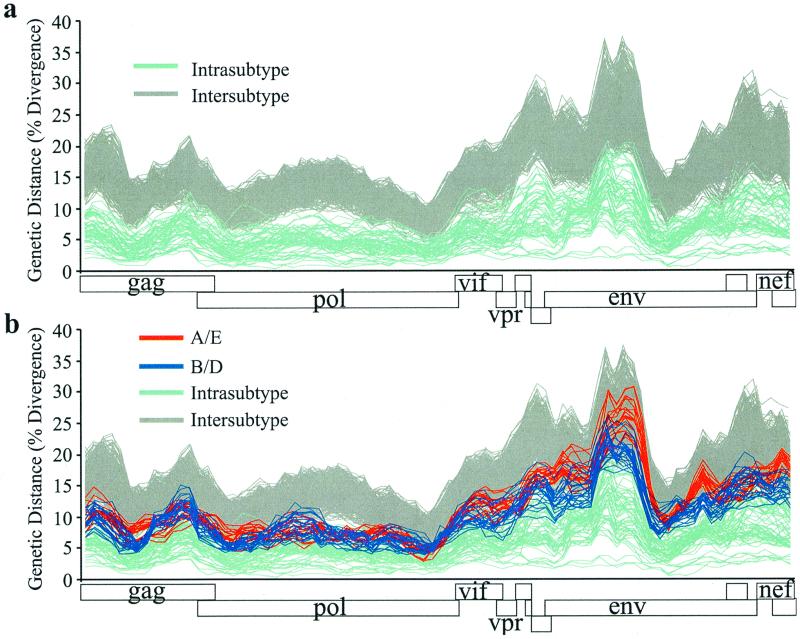
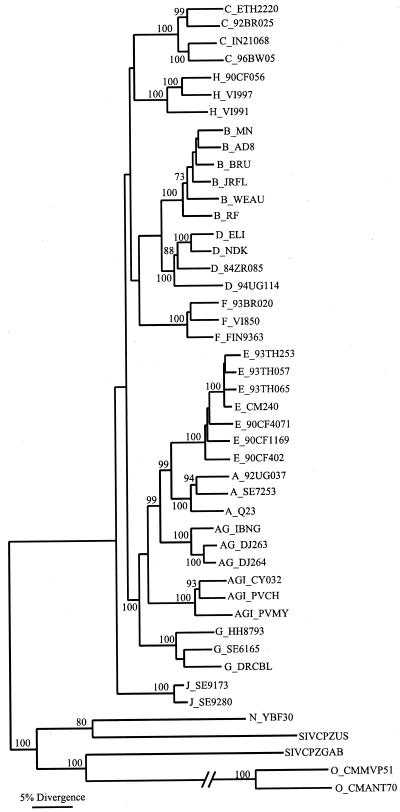
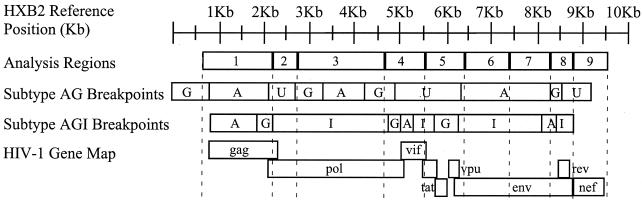
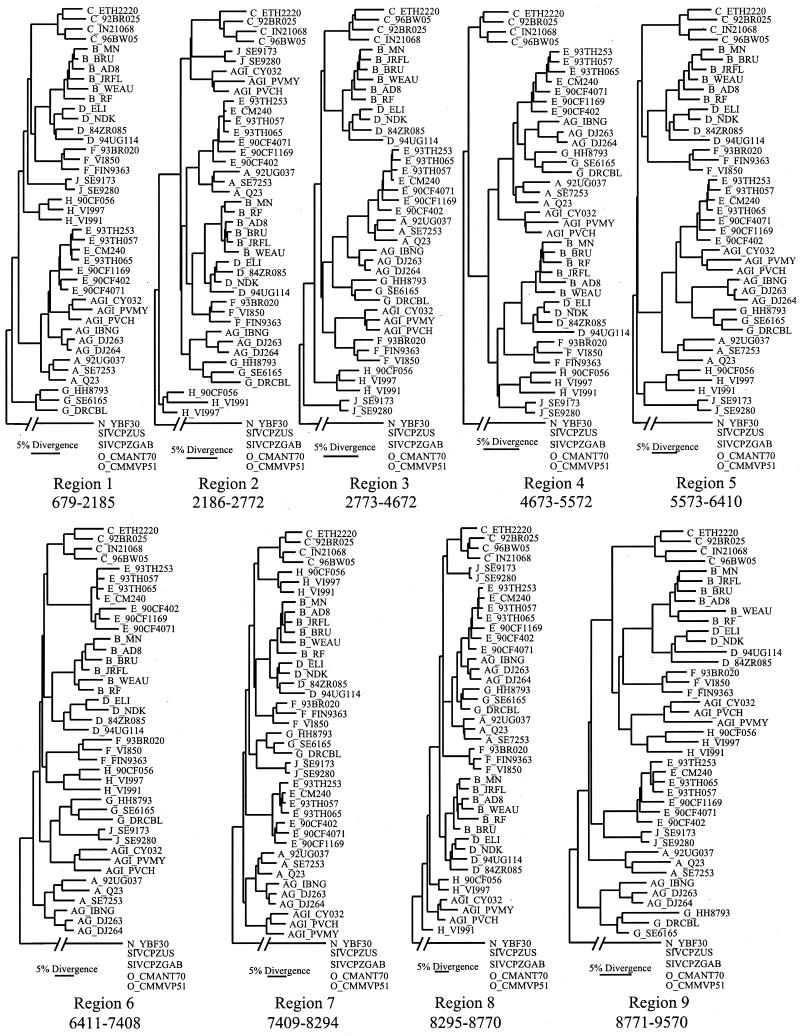
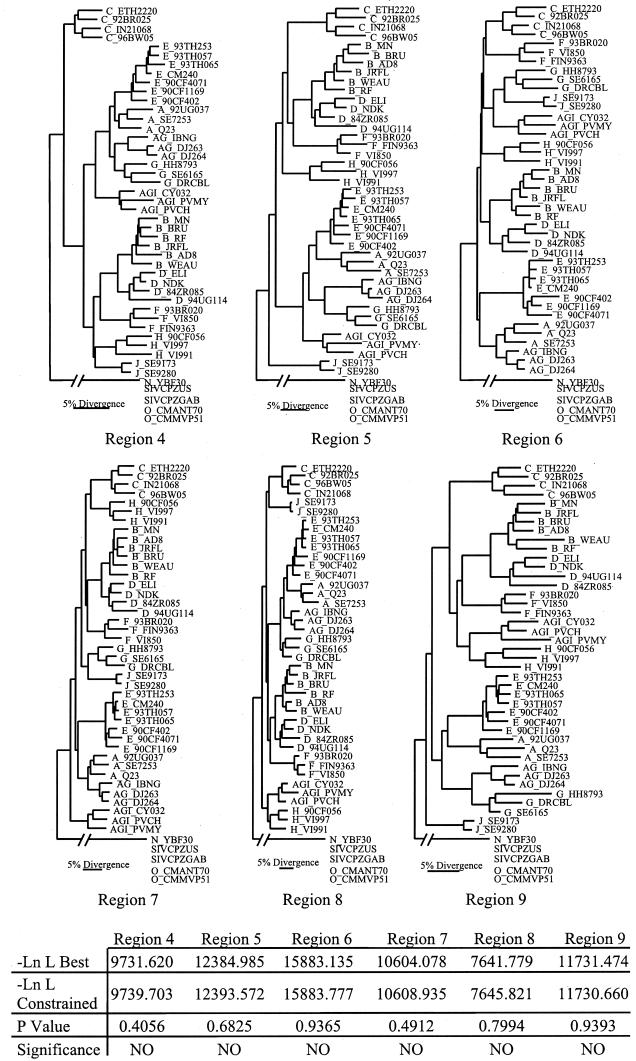
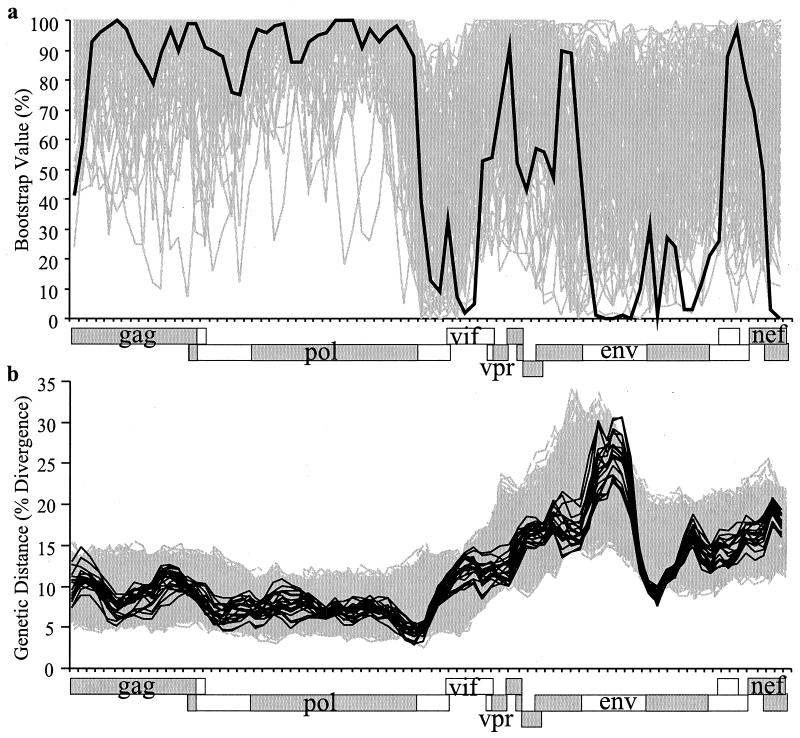
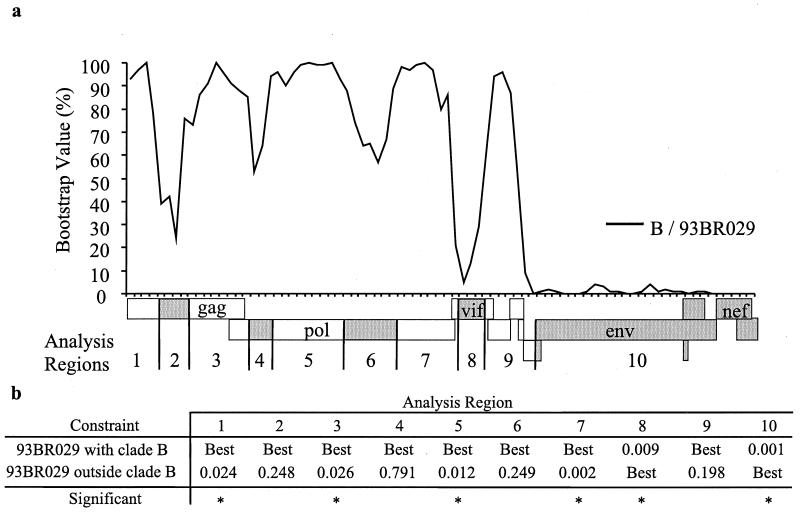
The human immunodeficiency virus type 1 (HIV-1) epidemic in Southeast Asia has been largely due to the emergence of clade E (HIV-1E). It has been suggested that HIV-1E is derived from a recombinant lineage of subtype A (HIV-1A) and subtype E, with multiple breakpoints along the E genome. We obtained complete genome sequences of clade E viruses from Thailand (93TH057 and 93TH065) and from the Central African Republic (90CF11697 and 90CF4071), increasing the total number of HIV-1E complete genome sequences available to seven. Phylogenetic analysis of complete genomes showed that subtypes A and E are themselves monophyletic, although together they also form a larger monophyletic group. The apparent phylogenetic incongruence at different regions of the genome that was previously taken as evidence of recombination is shown to be not statistically significant. Furthermore, simulations indicate that bootscanning and pairwise distance results, previously used as evidence for recombination, can be misleading, particularly when there are differences in substitution or evolutionary rates across the genomes of different subtypes. Taken jointly, our analyses suggest that there is inadequate support for the hypothesis that subtype E variants are derived from a recombinant lineage. In contrast, many other HIV strains claimed to have a recombinant origin, including viruses for which only a single parental strain was employed for analysis, do indeed satisfy the statistical criteria we propose. Thus, while intersubtype recombinant HIV strains are indeed circulating, the criteria for assigning a recombinant origin to viral structures should include statistical testing of alternative hypotheses to avoid inappropriate assignments that would obscure the true evolutionary properties of these viruses.


Figures

FIG. 1
FIG. 1
Plot showing bootstrap clustering values comparing subtypes A and E along the genome. The x axis shows the relative position across the HIV-1 genome. Numbered sections along the HIV-1 gene map identify the nine contiguous genomic regions that were used in later analyses.
FIG. 2
FIG. 2
Nucleotide divergence measurements across the HIV-1 M group genome for alignment 2. (a) Pairwise distance plot showing intra- and intersubtype maximum likelihood distances. The gray lines indicate the intersubtype distances across the genome for all subtype pairs except A versus E and B versus D. The teal lines indicate intrasubtype distances across the genome. (b) Pairwise distance plot showing intra- and intersubtype maximum likelihood distances as described for panel a, with A/E and B/D intersubtype distances included. The x axis shows the relative position across the HIV-1 genome.
FIG. 3
FIG. 3
Maximum likelihood phylogenetic relationships of newly derived HIV-1 clade E viral genomes and complete genomes representative of other HIV-1 group M clades, with bootstrap values of 70% or greater indicated. The tree was constructed using the ML method and the GTR substitution model as described in Materials and Methods and reference .
FIG. 4
FIG. 4
Locations of the nine adjacent regions used in the analysis of clade E and A variants (numbered 1 through 9), along with the inferred mosaic structures for subtypes AG and AGI (3, 10). Approximate genomic coordinates are indicated by the position within the HXB2 reference sequence. Regions of different subtypes located in the AG and AGI sequences are indicated by the single letters A, G, and I. U, unknown. Dashed lines indicate the breakpoints for the nine analyzed regions superimposed onto the AG, AGI, and HIV-1 gene maps.
FIG. 5
FIG. 5
Maximum likelihood trees for each of the nine genome segments (shown in Fig. 4), showing the phylogenetic relationships of clade E viruses in comparison to representative sequences of other HIV-1 group M clades. The coordinates of each segment are given relative to the HXB2 genome. Subtype designations are indicated in the names of the sequences (i.e., J_ indicates subtype J).
FIG. 6
FIG. 6
Kishino-Hasegawa test of topological incongruence across the entire genome. For each region indicated, the best-tree topology (shown in Fig. 5) was compared to the constrained-tree topology shown that forced clade E sequences to group either with clade A exclusively or with clades A and AG. In regions 6 and 7, where clade E was forced to group with clades A and AG, clade AG has been reported to be of subtype A (3). Likelihood scores for the best and constrained topologies are indicated, along with P values for each regional comparison (statistical significance was set as α being 0.05). A P value of <0.05 indicates that the best topology is significantly better than the constrained topology.
FIG. 7
FIG. 7
Bootscan and pairwise distance analyses of real and simulated nucleotide sequence alignment data sets. (a) Bootscan plot showing the bootstrap value along the genome of subtypes A and E forming a monophyletic group for the real data (black line) and 10 independent simulations (gray lines) across the genome. The x axis shows the relative position across the HIV-1 genome, with the nine contiguous regions indicated by the alternately shaded sections. (b) Pairwise distance plots showing intersubtype maximum likelihood distances of the observed data (black lines) and 10 independent simulations (gray lines) across the genome. The x axis shows the relative position across the HIV-1 genome, with the nine contiguous regions indicated by the alternately shaded sections.
FIG. 8
FIG. 8
Evaluation of the B/F recombinant 93BR029 in analyses of only one of the two parental strains. For these analyses, subtype F sequences were removed from the sequence alignments, creating a situation where subtype B was the only parental sequence studied. (a) Bootscan plot showing bootstrap clustering values comparing the variant 93BR029 and subtype B variants along the genome. The x axis shows the relative position across the HIV-1 genome. Numbered sections along the HIV-1 gene map identify the 10 contiguous genomic regions that were used for Kishino-Hasegawa testing. (b) Kishino-Hasegawa test of topological incongruence across the entire genome. For each region indicated, the best-tree topology that grouped 93BR029 with the subtype B sequences was compared to the best-tree topology that placed 93BR029 outside of the subtype B clade. The tree topology that produced the highest likelihood score was labeled “Best” and was compared to the remaining topology using the Kishino-Hasegawa test. P values for each regional comparison are indicated with statistical significance set as α being 0.05 (statistically significant results were marked with an asterisk). A P value of < 0.05 indicates that the “Best” topology is significantly better than the other topology.
FIG. 9
FIG. 9
Kishino-Hasegawa test results over the vif and env regions of the HIV-1 genome. The best-tree topology (shown in Fig. 5) was compared to the constrained-tree topology shown here which forced clade E sequences to form a common node with clade A sequences that was evolutionarily closer to clade A than clade AG was to clade A. In these regions clade AG is reported to be of subtype A, and thus the constrained tree places clade A sequences within the A/AG cluster. Likelihood scores and P values were derived as described in the legend to Fig. 6.

References

    1. Burke D S. Recombination in HIV: an important viral evolutionary strategy. Emerg Infect Dis. 1997;3:253–259. - PMC - PubMed
    1. Carr J K, Foley B T, Leitner T, Salminen M, Korber B, McCutchan F. Reference sequences representing the principal genetic diversity of HIV-1 in the pandemic. Vol. 1999. Los Alamos, N.M: Los Alamos National Laboratory; 1999.
    1. Carr J K, Salminen M O, Albert J, Sanders-Buell E, Gotte D, Birx D L, McCutchan F E. Full genome sequences of human immunodeficiency virus type 1 subtypes G and A/G intersubtype recombinants. Virology. 1998;247:22–31. - PubMed
    1. Carr J K, Salminen M O, Koch C, Gotte D, Artenstein A W, Hegerich P A, St. Louis D, Burke D S, McCutchan F E. Full-length sequence and mosaic structure of a human immunodeficiency virus type 1 isolate from Thailand. J Virol. 1996;70:5935–5943. - PMC - PubMed
    1. Cornelissen M, Kampinga G, Zorgdrager F, Goudsmit J the UNAIDS Network for HIV Isolation and Characterization. Human immunodeficiency virus type 1 subtypes defined by env show high frequency of recombinant gag genes. J Virol. 1996;70:8209–8212. - PMC - PubMed

Publication types

Associated data

LinkOut - more resources