

A noninvasive imaging modality for cardiac arrhythmias
- PMID: 11044435
- PMCID: PMC2034298
- DOI: 10.1161/01.cir.102.17.2152
A noninvasive imaging modality for cardiac arrhythmias
Abstract
Background: The last decade witnessed an explosion of information regarding the genetic, molecular, and mechanistic basis of heart disease. Translating this information into clinical practice requires the development of novel functional imaging modalities for diagnosis, localization, and guided intervention. A noninvasive modality for imaging cardiac arrhythmias is not yet available. Present electrocardiographic methods cannot precisely localize a ventricular tachycardia (VT) or its key reentrant circuit components. Recently, we developed a noninvasive electrocardiographic imaging modality (ECGI) that can reconstruct epicardial electrophysiological information from body surface potentials. Here, we extend its application to image reentrant arrhythmias.
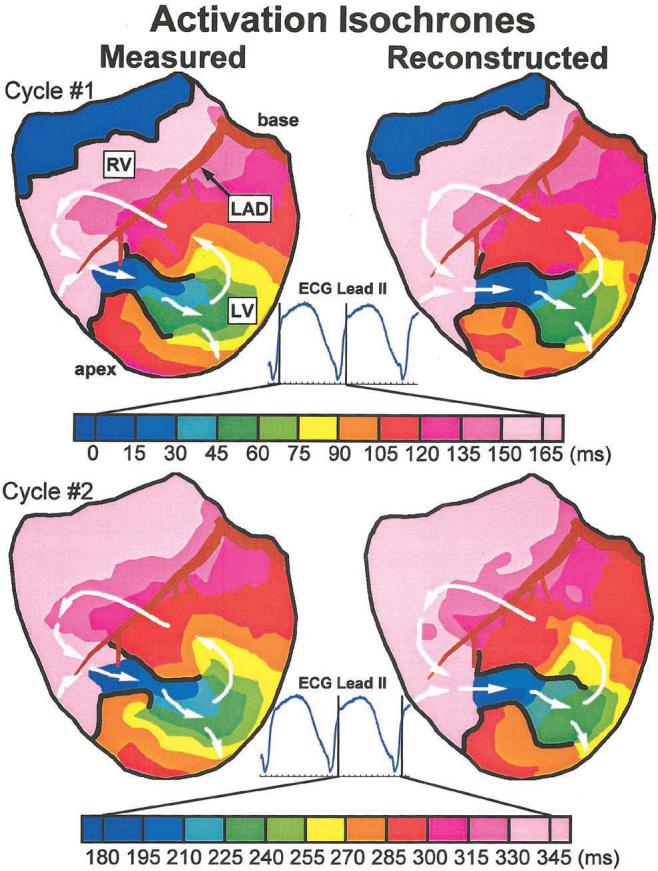
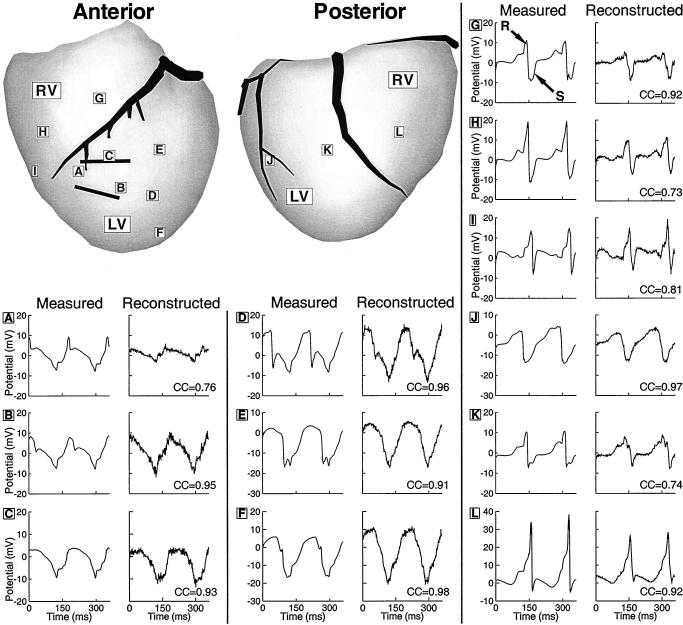
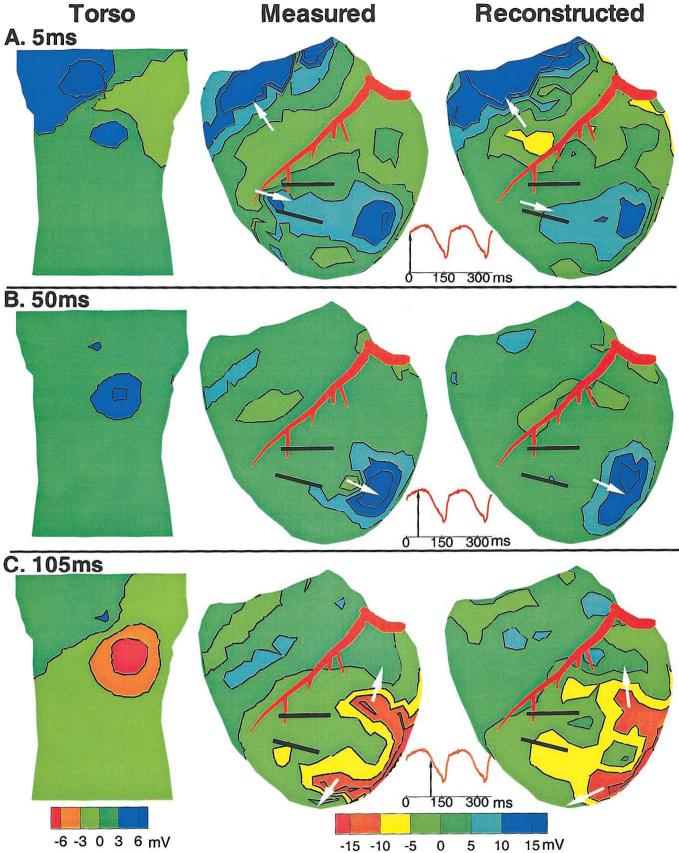
Methods and results: Epicardial potentials were recorded during VT with a 490 electrode sock during an open chest procedure in 2 dogs with 4-day-old myocardial infarctions. Body surface potentials were generated from these epicardial potentials in a human torso model. Realistic geometry errors and measurement noise were added to the torso data, which were then used to noninvasively reconstruct epicardial isochrones, electrograms, and potentials with excellent accuracy. ECGI reconstructed the reentry pathway and its key components, including (1) the central common pathway, (2) the VT exit site, (3) lines of block, and (4) regions of slow and fast conduction. This allowed for detailed characterization of the reentrant circuit morphology.
Conclusions: ECGI can noninvasively image arrhythmic activation on the epicardium during VT to identify and localize key components of the arrhythmogenic pathway that can be effective targets for antiarrhythmic intervention.
Figures
References
-
- Myerburg RJ, Kessler KM, Kimura S, et al. Life-threatening ventricular arrhythmias: the link between epidemiology and pathophysiology. In: Zipes DP, Jalife J, editors. Cardiac electrophysiology: From Cell to Bedside. 2nd ed. Saunders; Philadelphia, Pa: 1995. pp. 723–31.
-
- Josephson M, Horowitz L, Waxman H, et al. Sustained ventricular tachycardia: role of the 12-lead electrocardiogram in localizing site of origin. Circulation. 1981;64:257–272. - PubMed
-
- Klug D, Ferracci A, Molin F, et al. Body surface potential distributions during idiopathic ventricular tachycardia. Circulation. 1995;91:2002–2009. - PubMed
-
- Liebman J, Zeno JA, Olshansky B, et al. Electrocardiographic body surface potential mapping in the Wolff-Parkinson-White syndrome: noninvasive determination of the ventricular insertion sites of accessory atrioventricular connections. Circulation. 1991;83:886–901. - PubMed
-
- Sippensgroenewegen A, Spekhorst H, van Hemel NM, et al. Value of body surface mapping in localizing the site of origin of ventricular tachycardia in patients with previous myocardial infarction. J Am Coll Cardiol. 1994;24:1708–1724. - PubMed
Publication types
MeSH terms
Grants and funding
LinkOut - more resources
Full Text Sources
Other Literature Sources
Medical
