. 2000 Nov 1;20(21):7914-21.
doi: 10.1523/JNEUROSCI.20-21-07914.2000.

Slow desensitization regulates the availability of synaptic GABA(A) receptors

Affiliations

Slow desensitization regulates the availability of synaptic GABA(A) receptors

L S Overstreet et al. J Neurosci. .

Abstract

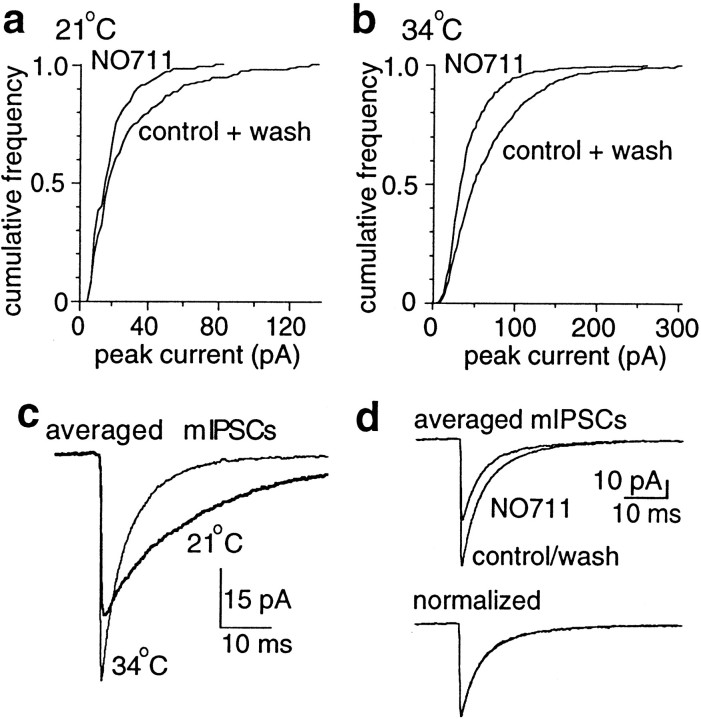
At central synapses, a large and fast spike of neurotransmitter efficiently activates postsynaptic receptors. However, low concentrations of transmitter can escape the cleft and activate presynaptic and postsynaptic receptors. We report here that low concentrations of GABA reduce IPSCs in hippocampal neurons by preferentially desensitizing rather than opening GABA(A) channels. GABA transporter blockade also caused desensitization by locally elevating GABA to approximately 1 microm. Recovery of the IPSC required several seconds, mimicking recovery of the channel from slow desensitization. These results indicate that low levels of GABA can regulate the amplitude of IPSCs by producing a slow form of receptor desensitization. Accumulation of channels in this absorbing state allows GABA(A) receptors to detect even a few molecules of GABA in the synaptic cleft.


Figures

Fig. 1.
Fig. 1.
Preequilibration with 1 μm GABA reduced the IPSC amplitude. a, Top panel, Schematic diagram of the protocol used to measure the effect of GABA on the IPSC. Autaptic IPSCs were evoked by voltage steps (Vc) applied before GABA application (a), and at intervals from 1.5 to 27.5 sec after solution exchange (b). Bottom panel, Averaged IPSC evoked at 1.5 sec after solution exchange (b) overlaid on the control IPSC (a). GABA reduced the amplitude with no change in the time course. b, Slow recovery of the IPSC after GABA exposure. Each trace is the average of four to seven IPSCs, normalized to the amplitude of the control IPSC. The inward current produced by GABA application is illustrated at the end of the control trace. The time course of recovery of the IPSC amplitude was fit with a single exponential function. Each point represents the mean ± SEM from five cells.
Fig. 2.
Fig. 2.
Preequilibration with low concentrations of GABA desensitized GABAA receptors. a, Top panel, Schematic diagram of the protocol used to measure desensitization by GABA in outside-out patches. Maximal available GABAA currents were evoked by brief saturating GABA applications (10 mm, 20 msec duration, upward deflection) delivered before and after low concentrations of GABA (0.4–10 μm, 10 msec–20 sec). An example of desensitization produced by preequilibration with 2 μm GABA is illustrated (seven traces overlaid). Each trace is normalized to the peak amplitude of the control current. Bottom panel, Fractional availability declined as a function of preequilibration duration and GABA concentration. Each symbol is the mean ± SEM of currents from three to nine patches. The onset of desensitization was fitted with a single exponential function and a constant (for 0.4 μm GABA) or the sum of two exponential functions and a constant (dotted lines). For 0.4 μm GABA, τ = 3.2 sec (14% of total amplitude). For 1 μmGABA, τfast = 53 msec (6%) and τslow = 3.5 sec. For 2 μm GABA, τfast = 41 msec (15%) and τslow= 2.9 sec. For 5 μm GABA, τfast = 85 msec (50%) and τslow = 2.1 sec. For 10 μm GABA, τfast = 42 msec (57%) and τslow = 2.7 sec. b, Top panel, Schematic diagram of the protocol used to measure recovery from desensitization in outside-out patches. GABA test pulses (10 mm, 20 msec, upward deflection) were delivered at intervals from 0.1 to 34 sec after GABA exposure (1 or 5 μm, 20 sec duration). An example of recovery from exposure to 5 μm GABA is illustrated. Six traces are overlaid, normalized to the peak amplitude of the control current.Bottom panel, The recovery from desensitization produced by 1 μm GABA was best fit by a single exponential, whereas an additional faster component was present at 5 μm. Each symbol is the mean ± SEM from six to eight patches.
Fig. 3.
Fig. 3.
The GABA uptake inhibitor NO711 reduced the IPSC amplitude. a, NO711 (100 μm) reduced the IPSC amplitude in the presence of the GABAB receptor antagonists 2-hydroxysaclofen (200 μm) or CGP55845 (1 μm). Asterisks indicate a significant difference between the amplitude of IPSCs in NO711 and the corresponding control. The reduction of IPSC amplitude produced by NO711 was not accompanied by a change in the paired-pulse ratio. In control experiments, 2-hydroxysaclofen (200 μm) attenuated the reduction in IPSC produced by baclofen (1 μm, 41 ± 9% of control in baclofen, 90 ± 9% in baclofen + 2-hydroxysaclofen; n = 7).b, The mean2/variance was reduced proportionally to the mean amplitude for IPSCs recorded in baclofen (1 μm, ▵), but not for IPSCs recorded in NO711 (●, in CGP55845; ♦, in 2-hydroxysaclofen). The mean and mean2/variance were computed for each condition and normalized to control values. The average slope of the lines connecting each point to the control point was 0.06 ± 0.23 for NO711 (thick line) and 1.03 ± 0.07 for baclofen (thin line). The nonoverlapping 95% confidence limits (dotted lines) indicate that the slope for NO711 was not significantly different from zero, suggesting a postsynaptic site of action. c, NO711 (100 μm) reduced the amplitude of patch currents activated by 100 μm GABA, but this direct effect cannot account for the reduction of the IPSC by NO711. Inset, The recovery from the direct action of NO711 on GABA-activated patch currents was very rapid (τ = 56 msec; n = 2–10).
Fig. 4.
Fig. 4.
Recovery of the IPSC after inhibition of uptake.a, Recovery of the IPSC amplitude after NO711 was fit with a single exponential function (same protocol as Fig. 1). Recovery from NO711 (τ = 10.0 sec, n = 4–7 cells per time point) was similar to recovery from GABA (Figs. 1,2b). Recovery of the IPSC decay was much faster (see Results). b, Tiagabine (100 μm) reduced the amplitude and prolonged the decay of IPSCs. The decay of the IPSC was fit with the sum of either two or three exponential functions, and the weighted decay was calculated by the equationA1τ1 +A2τ2 +A3τ3, whereA is the relative amplitude of each component and τ is its time constant. Inset, Both uptake inhibitors prolonged the weighted decay. For NO711, τ = 46 ± 7 msec in control and 50 ± 7 msec in NO711 (n = 7). For tiagabine, τ = 57 ± 9 msec in control and 79 ± 13 msec in tiagabine (n = 8). The uptake inhibitors increased the amplitude of the slow component of decay without altering the time constants. c, The recovery of the IPSC decay to control values after removal of tiagabine (●, n = 4–9 cells per time point) was faster than the recovery of the peak amplitude (○, n = 3–6 cells per time point) in the same population of cells. The recovery of the amplitude and decay were fit with single exponential functions (τamplitude = 13.3 sec, τdecay = 1.3 sec).
Fig. 5.
Fig. 5.
A competitive antagonist attenuated the effect of NO711. An example of the effect of SR95531 on the reduction of the IPSC amplitude produced by NO711. Top panel, NO711 (100 μm) reduced the IPSC by 44% under control conditions.Bottom panel, In the presence of SR95531 (200 nm) the IPSC was 56 ± 9% of control, and NO711 reduced the amplitude further by only 23% (same cell as top panel). SR95531 significantly attenuated the reduction of the IPSC produced by NO711 (n = 4). In each cell the effect of NO711 was measured in the presence and absence of SR95531. SR95531 had no effect on the paired-pulse ratio.
Fig. 6.
Fig. 6.
Uptake inhibitors increased GABA in the synaptic cleft. a, The fractional availability of patch receptors measured after 20 sec of GABA preequilibration and the peak current activated during preequilibration were plotted against the concentration of GABA. These data were fit with the Hill equation (dotted lines, n = 1.3 for both fits) and predict the reduction in IPSC amplitude caused by application of 1 μm GABA to the synapse. The reduction in IPSC amplitude after NO711 was consistent with desensitization induced by elevation of GABA to an average concentration of ∼1 μmat the synapse. b, Whole-cell application of GABA (1 μm, top trace) produced an inward current, but NO711 did not (100 μm, bottom trace). However, both reduced the IPSC amplitude to a similar extent after a 20 sec equilibration (test IPSCs were evoked 1.5 sec after GABA or NO711 washout). Thus, the NO711-induced elevation in GABA appears to be confined to the synapse.
Fig. 7.
Fig. 7.
Block of GABA transport in hippocampal slices reduced mIPSCs.a, b, The amplitude of mIPSCs recorded in dentate granule cells was reduced by NO711 (100 μm) at room temperature and at 34°C. Data from individual experiments are shown, with events from the control and wash periods combined. c, Averaged mIPSCs recorded in the same cell at room temperature and 34°C. In five cells, increasing the temperature increased the median frequency of events (3.2 ± 0.6 Hz at 34°C vs 0.8 ± 0.2 Hz at room temperature) and the median amplitude (35 ± 5 pA vs 24 ± 2 pA) and reduced the median 20–80% rise time (0.28 ± 0.04 msec vs 0.58 ± 0.04 msec) and weighted decay time constant (8.5 ± 0.8 msec vs 25.7 ± 2.3 msec). d, NO711 had no effect on the time course of decay of the ensemble average mIPSC at either temperature.

Similar articles

Cited by

References

    1. Asztely F, Erdemli G, Kullmann DM. Extrasynaptic glutamate spillover in the hippocampus: dependence on temperature and the role of active glutamate uptake. Neuron. 1997;18:281–293. - PubMed
    1. Attwell D, Barbour B, Szatkowski M. Nonvesicular release of neurotransmitter. Neuron. 1993;11:401–407. - PubMed
    1. Barbour B, Häusser M. Intersynaptic diffusion of neurotransmitter. Trends Neurosci. 1997;20:377–384. - PubMed
    1. Bekkers JM, Stevens CF. Excitatory and inhibitory autaptic currents in isolated hippocampal neurons maintained in cell culture. Proc Natl Acad Sci USA. 1991;88:7834–7838. - PMC - PubMed
    1. Berger T, Schwarz C, Kraushaar U, Monyer H. Dentate gyrus basket cell GABAA receptors are blocked by Zn2+ via changes of their desensitization kinetics: an in situ patch-clamp and single-cell PCR study. J Neurosci. 1998;18:2437–2448. - PMC - PubMed

Publication types

MeSH terms

LinkOut - more resources