. 2000 Nov 1;20(21):7922-31.
doi: 10.1523/JNEUROSCI.20-21-07922.2000.

Developmental changes in synaptic AMPA and NMDA receptor distribution and AMPA receptor subunit composition in living hippocampal neurons

Affiliations

Developmental changes in synaptic AMPA and NMDA receptor distribution and AMPA receptor subunit composition in living hippocampal neurons

L Pickard et al. J Neurosci. .

Abstract

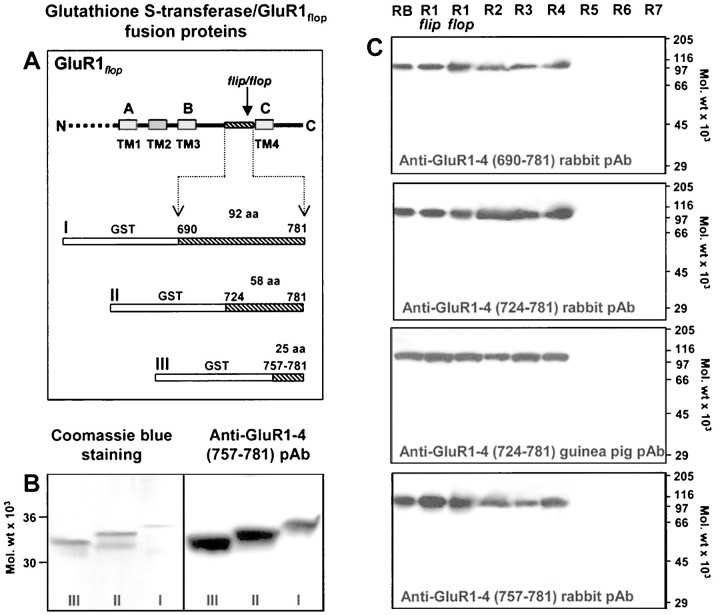
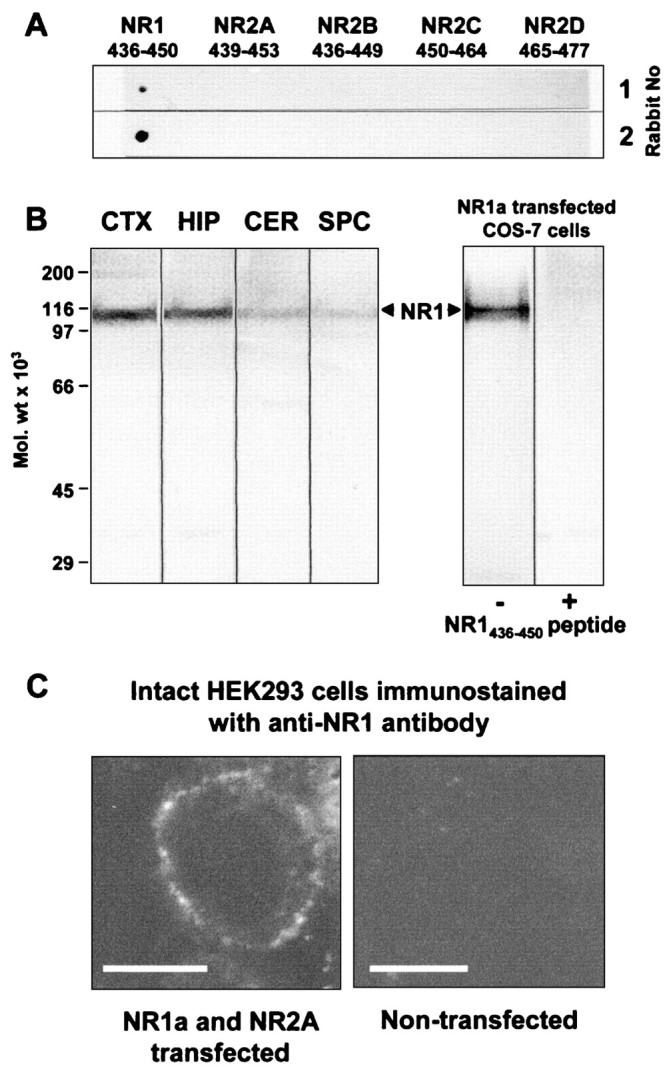
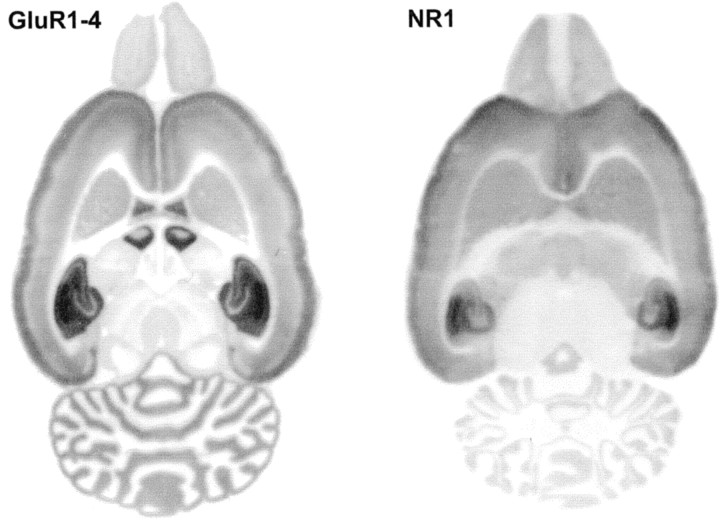
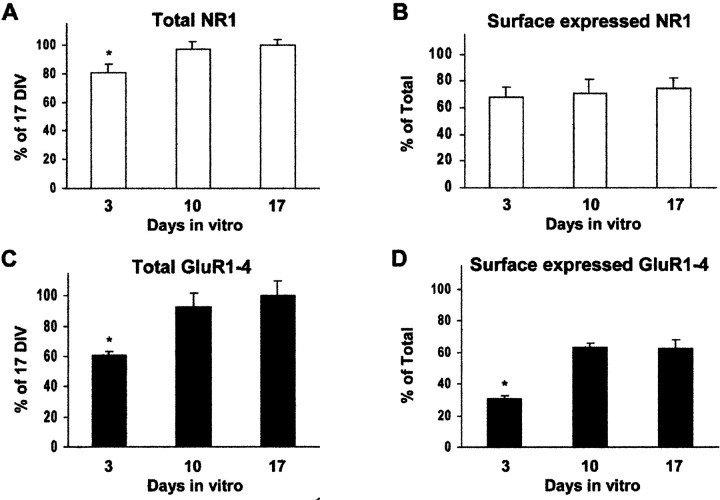
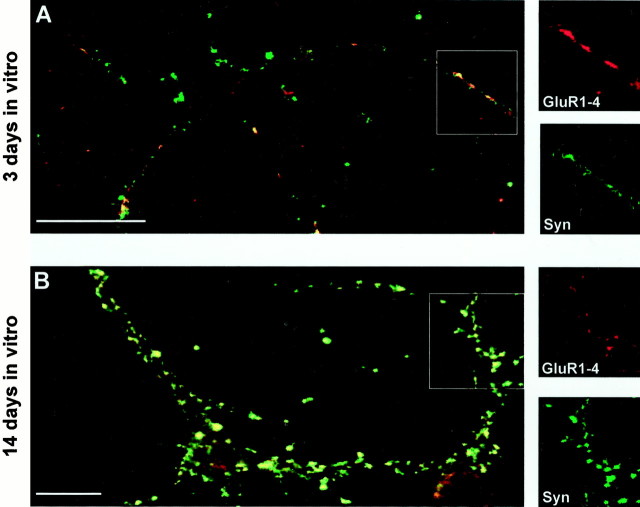
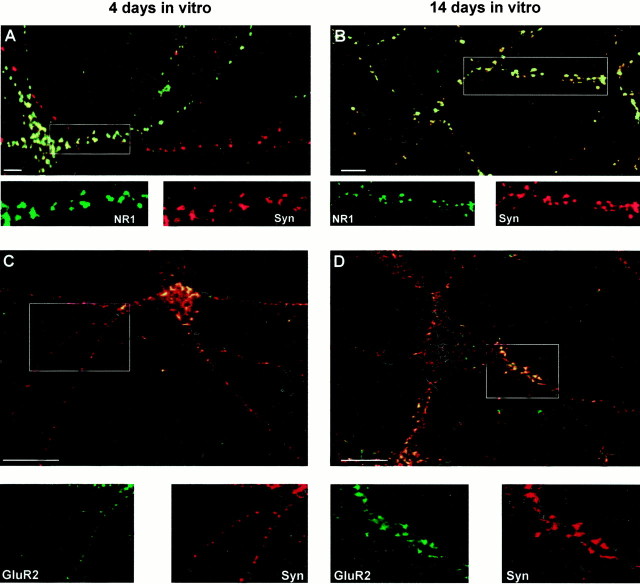
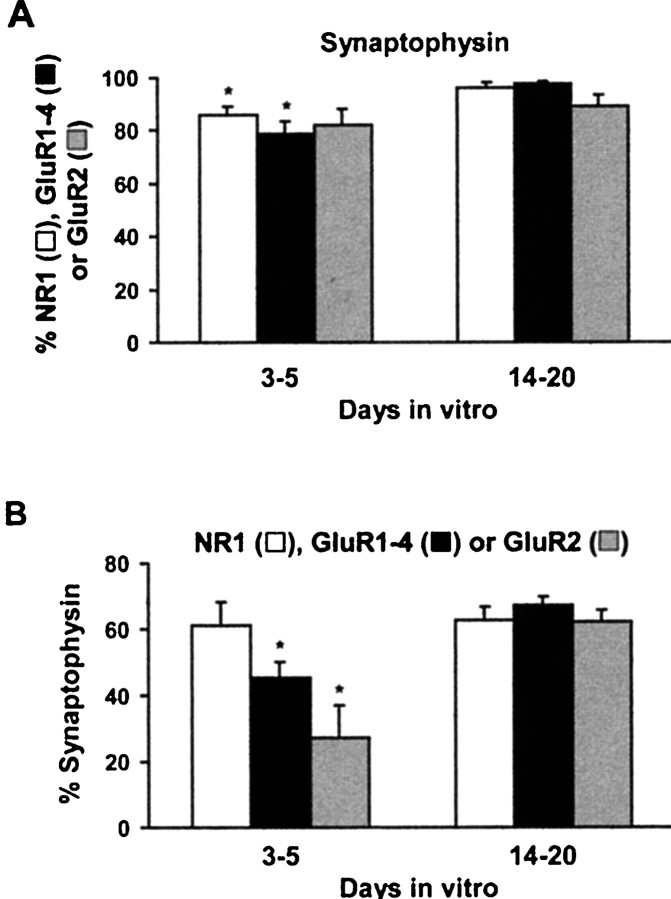
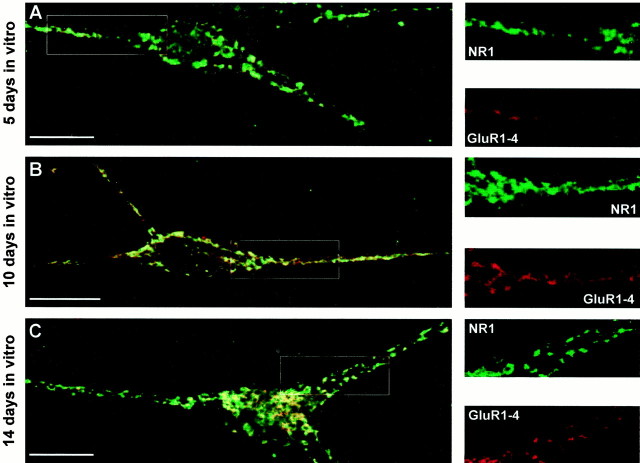
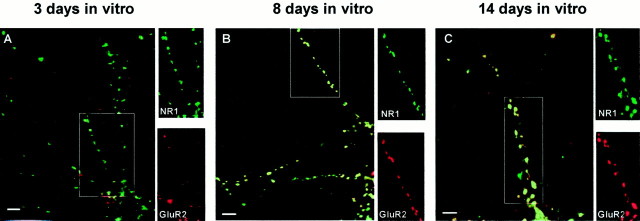
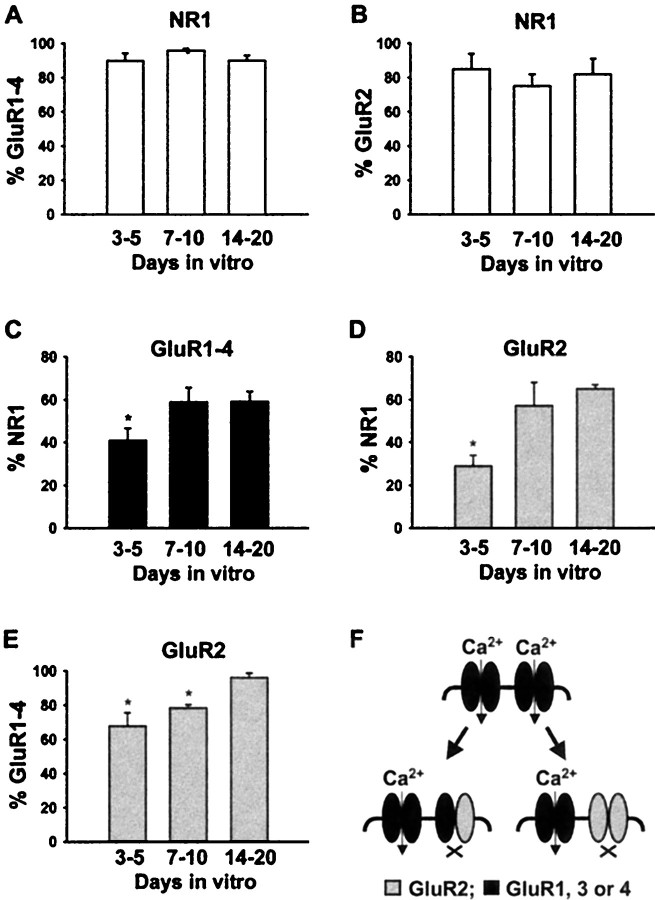
AMPA and NMDA receptors mediate most excitatory synaptic transmission in the CNS. We have developed antibodies that recognize all AMPA or all NMDA receptor variants on the surface of living neurons. AMPA receptor variants were identified with a polyclonal antibody recognizing the conserved extracellular loop region of all four AMPA receptor subunits (GluR1-4, both flip and flop), whereas NMDA receptors were immunolabeled with a polyclonal antibody that binds to an extracellular N-terminal epitope of the NR1 subunit, common to all splice variants. In non-fixed brain sections these antibodies gave labeling patterns similar to autoradiographic distributions with particularly high levels in the hippocampus. Using these antibodies, in conjunction with GluR2-specific and synaptophysin antibodies, we have directly localized and quantified surface-expressed native AMPA and NMDA receptors on cultured living hippocampal neurons during development. Using a quantitative cell ELISA, a dramatic increase was observed in the surface expression of AMPA receptors, but not NMDA receptors, between 3 and 10 d in culture. Immunocytochemical analysis of hippocampal neurons between 3 and 20 d in vitro shows no change in the proportion of synapses expressing NMDA receptors (approximately 60%) but a dramatic increase (approximately 50%) in the proportion of them that also express AMPA receptors. Furthermore, over this period the proportion of AMPA receptor-positive synapses expressing the GluR2 subunit increased from approximately 67 to approximately 96%. These changes will dramatically alter the functional properties of hippocampal synapses.


Figures

Fig. 1.
Fig. 1.
Antibodies raised against different segments of the GluR1flop TM3–TM4 loop can be used to identify all known AMPA receptor subunit proteins. A, Site-directed antibodies were raised against three GST fusion proteins, containing amino acid residues 690–781 (I), 724–781 (II), and 757–781 (III) of GluR1flop. The location of putative membrane-spanning domains [TM1–4 or A–C (Hollmann et al., 1994) are indicated in the figure]. B, The immunostaining of GST-GluR1flop fusion proteins. GST fusion proteins (0.25 μg/lane), containing residues 757–781 (III), 724–781 (II), or 690–781 (I) of the GluR1flop subunit, were either stained with Coomassie blue or immunostained with a polyclonal rabbit antibody raised against the GST-GluR1757–781 fusion protein. C, Characterization of the subunit specificity of antibodies raised against residues 690–781, 724–781, and 757–781 of the GluR1flop AMPA receptor subunit. Membrane proteins (30 μg/lane) from rat brain (RB) and transiently transfected COS-7 cells expressing either GluR1–4 (AMPA) or GluR5–7 (kainate) receptor subunits were immunostained with the indicated antibody (1 μg/ml). All four antibodies cross-react with all of the AMPA receptor subunit proteins (GluR1–4), and both flipand flop alternatively spliced isoforms of GluR1. The kainate receptor subunits (GluR5–7) were unlabeled.
Fig. 2.
Fig. 2.
Characterization of the NR1 antibody using synthetic peptides, rat brain membrane fractions, and transiently transfected COS-7 and HEK 293 cells. A, Dot-blot assay of antipeptide NR1 antibody specificity using synthetic peptides corresponding to sequences of different NMDA receptor subunits. Immune sera from two rabbits (1:200 dilution) reacted only with the NR1 peptide, confirming the sequence specificity of these anti-NR1 antibodies. B, Immunoblot analysis of NR1 subunit proteins in rat brain and transiently transfected COS-7 cell membrane preparations. Aliquots of cerebral cortical (CTX), hippocampal (HIP), cerebellar (CER), spinal cord (SPC), and NR1a-transfected COS-7 cell membrane fractions (50 μg of protein/lane) were prepared, as described previously (Molnar et al., 1993; McIlhinney and Molnar, 1996). The bound antibodies were detected by reaction with alkaline phosphatase-conjugated anti-rabbit IgG. The preincubation of the antibody with the NR1 (436–450) peptide (1 μg/ml) blocked the labeling. C, Immunofluorescence staining of intact nonpermeabilized HEK 293 cells after transient transfection with NR1a and NR2A subunits. Transfected cells showed specific surface staining with the anti-NR1 antibody, whereas untransfected cells showed no immunostaining. Scale bars, 10 μm.
Fig. 3.
Fig. 3.
Regional distribution of AMPA and NMDA receptor proteins in rat brain. AMPA and NMDA receptor protein distribution was analyzed on adult rat brain histoblots using affinity-purified anti-GluR1–4 (0.5 μg/ml) and anti-NR1 (1 μg/ml) antibodies. The bound antibodies were visualized using an alkaline phosphatase-conjugated anti-rabbit antibody.
Fig. 4.
Fig. 4.
Quantification of developmental changes in surface-expressed and total AMPA and NR1 immunoreactivity on cultured hippocampal neurons using cell ELISA. Immunoreactivity for the NR1 NMDA receptor subunit (A, B) and GluR1–4 AMPA receptor subunits (C, D) was compared in paraformaldehyde-fixed, nonpermeabilized (surface-expressed,B,D) and 1% Triton X-100 permeabilized (total, A,C) cells after 3, 10, or 17 d in vitro using an ELISA-based assay. The total immunoreactivity for NR1 and GluR1–4 subunits (A,C) was expressed as the percentage of the immunoreactivity obtained after 17 d in culture. The surface immunoreactivity for NR1 and GluR1–4 subunits (B,D) was expressed as the percentage of the total immunoreactivity after 3, 10, or 17 d in vitro. For each experiment, a minimum of three parallel samples was used. *p < 0.001 compared with samples in other age groups.
Fig. 5.
Fig. 5.
Colocalization of GluR1–4 and synaptophysin in hippocampal neurons in culture for 3 and 14 d. Colocalization (yellow) of GluR1–4 (red) and synaptophysin (Syn, green) on hippocampal neurons in culture for 3 (A) and 14 (B) d. The individual immunoreactivity for GluR1–4 and synaptophysin (Syn) in regions highlighted in the boxes are shown in the side panels. At 3–5 d in culture (A), 79 ± 5% of surface-expressed GluR1–4 puncta (4 fields, 950 puncta) contained synaptophysin-immunoreactive puncta. At 14–20 d in culture, 98 ± 1% of surface-expressed GluR1–4 puncta (4 fields, 375 puncta) contained synaptophysin-immunoreactive puncta. At 3–5 d in vitro 45 ± 5% of total synaptophysin puncta (4 fields, 950 puncta) contained GluR1–4 immunoreactivity, which increased to 67 ± 2% (4 fields, 375 puncta) at 14–20 d in vitro. Scale bars, 10 μm.
Fig. 6.
Fig. 6.
Colocalization of NR1 and GluR2 with synaptophysin in hippocampal neurons in culture for 4 and 14 d. Colocalization (yellow) of NR1 (green; A,B) or GluR2 (green; C,D) and synaptophysin (Syn, red) on hippocampal neurons in culture for 4 (A, C) and 14 (B, D) d. The individual immunoreactivity for NR1, GluR2, and synaptophysin (Syn) in regions highlighted in the boxesare shown in the bottom panels. At 3–5 d in culture (A), 85 ± 3% of surface-expressed NR1 puncta (6 fields, 748 puncta) contained synaptophysin-immunoreactive puncta. At this age 61 ± 7% of the total synaptophysin puncta (6 fields, 748 puncta) contained NR1. At 14–20 d in culture (B), 96 ± 2% of surface-expressed NR1 puncta (4 fields, 413 puncta) contained synaptophysin-immunoreactive puncta, whereas 63 ± 4% of total synaptophysin puncta (4 fields, 413 puncta) colocalized with NR1. At 3–5 d in culture (C), 82 ± 6% of surface-expressed GluR2 puncta (3 fields, 381 puncta) contained synaptophysin-immunoreactive puncta, whereas 27 ± 10% of the total synaptophysin (3 fields, 418 puncta) contained GluR2. At 14–20 d in culture (D) 89 ± 4% of surface-expressed GluR2 (4 fields, 366 puncta) contained synaptophysin-immunoreactive puncta, and 62 ± 3% of the total synaptophysin (4 fields, 366 puncta) contained GluR2. Scale bars, 5 μm.
Fig. 7.
Fig. 7.
Quantification of developmental changes in the colocalization of AMPA and NMDA receptor subunit proteins and synaptophysin. A, The majority of surface NR1 (■), GluR1–4 (▪), and GluR2 (░) clusters colocalized with the presynaptic marker protein synaptophysin. B, The percentage of the total synaptophysin-immunoreactive puncta containing NR1 (■) remained the same, whereas GluR1–4 (▪) and GluR2 (░) increased during development. Mean and SE was calculated based on at least three independent determinations; *p < 0.001 compared with samples in the 14- to 20-d-old groups.
Fig. 8.
Fig. 8.
Surface distribution of GluR1–4 and NR1 immunoreactivity during development of living hippocampal neurons in culture. Surface distribution of GluR1–4 (red) and NR1 (green) immunoreactivity on living hippocampal neurons in culture for 5 (A), 10 (B), and 14 (C) d. Areas of colocalization are shown in yellow on the left panels. The individual immunoreactivities for GluR1–4 and NR1 in region highlighted in the box are shown in theright panels. In 3- to 5-d-old living neurons (A) 41 ± 6% of surface-expressed NR1 puncta (5 fields, 610 puncta) contained GluR1–4 puncta. This increased to 59 ± 7% (8 field, 1255 puncta) and 59 ± 5% (6 field, 875 puncta) after 7–10 (B) and 14–20 d (C) in culture, respectively. Scale bars, 10 μm.
Fig. 9.
Fig. 9.
Surface distribution of GluR2 and NR1 immunoreactivity during development of living hippocampal neurons in culture. Surface distribution of GluR2 and NR1 immunoreactivity on living hippocampal neurons in culture for 3 (A), 8 (B), and 14 (C) d. Colocalization (yellow) of GluR2 (red) and NR1 (green) immunoreactivity on living hippocampal neurons. The individual immunoreactivities for GluR2 and NR1 in region highlighted in thebox are shown in the side panels. In 3- to 5-d-old neurons (A) 29 ± 5% of surface-expressed NR1 puncta (3 fields, 240 puncta) contained GluR2 puncta. This increased to 57 ± 11% (3 fields, 124 puncta) and 67 ± 2% (3 fields, 173 puncta) after 7–10 (B) and 14–20 d (C) in culture, respectively. Scale bars, 5 μm.
Fig. 10.
Fig. 10.
Quantification of developmental changes in the colocalization of AMPA and NMDA receptor subunit proteins. The percentage of GluR1–4 (A) and GluR2 (B) clusters that contain NR1 on the surface of living hippocampal neurons at different time points. The number of NR1 clusters containing GluR1–4 (C) or GluR2 (D) increased on the surface of living hippocampal neurons during development. E, The number of GluR2-containing GluR1–4 clusters increased between day 3 and 20 in culture. F, Schematic diagram of two potential molecular mechanisms by which the relative increase in synaptic GluR2 can decrease Ca2+ influx at synapses by forming Ca2+-impermeable AMPA receptors. Mean and SE was calculated based on at least three independent determinations; *p < 0.001 compared with samples in the 14- to 20-d-old groups.

References

    1. Aoki C, Venkatesan C, Go C-G, Mong JA, Dawson TM. Cellular and subcellular localization of NMDA-R1 subunit immunoreactivity in the visual cortex of adult and neonatal rats. J Neurosci. 1994;14:5202–5222. - PMC - PubMed
    1. Archibald K, Molnar E, Henley JM. Differential changes in the subcellular distribution of α-amino-3-hydroxy-5-methyl-4-isoxazole propionate and N-methyl-d-aspartate receptors in neonate and adult rat cortex. Neurosci Lett. 1999;270:49–52. - PubMed
    1. Bear MF, Abraham WC. Long-term depression in the hippocampus. Annu Rev Neurosci. 1996;19:437–462. - PubMed
    1. Bennett JA, Dingledine R. Topology profile for a glutamate receptor: three transmembrane domains and a channel-lining reentrant membrane loop. Neuron. 1995;14:373–384. - PubMed
    1. Benke TA, Jones OT, Collingridge GL, Angelides KJ. N-methyl-d-aspartate receptors are clustered and immobilized on dendrites of living cortical-neurons. Proc Natl Acad Sci USA. 1993;90:7819–7823. - PMC - PubMed

Publication types

MeSH terms

LinkOut - more resources