. 2000 Nov 1;20(21):7951-63.
doi: 10.1523/JNEUROSCI.20-21-07951.2000.

Mice with combined gene knock-outs reveal essential and partially redundant functions of amyloid precursor protein family members

Affiliations

Mice with combined gene knock-outs reveal essential and partially redundant functions of amyloid precursor protein family members

S Heber et al. J Neurosci. .

Abstract

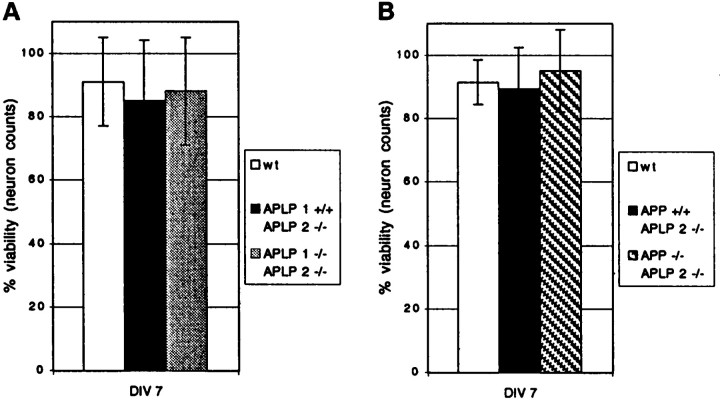
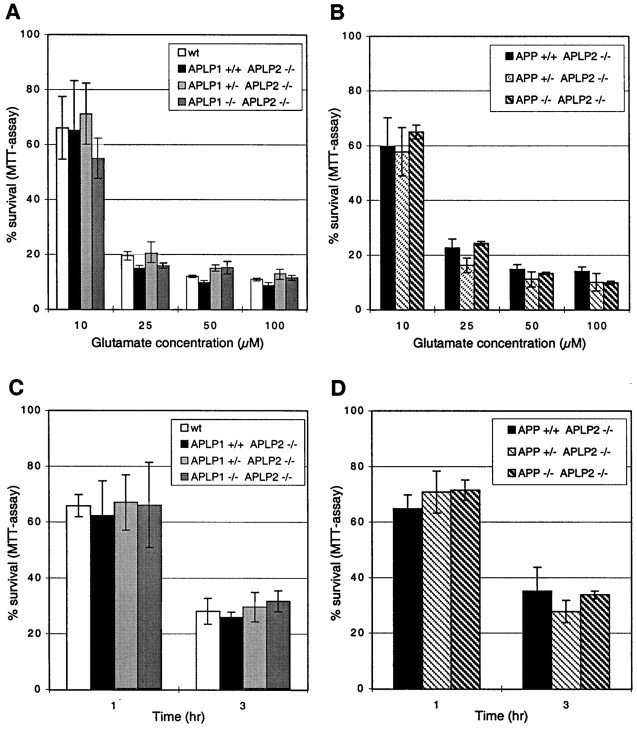
The amyloid precursor protein (APP) involved in Alzheimer's disease is a member of a larger gene family including amyloid precursor-like proteins APLP1 and APLP2. We generated and examined the phenotypes of mice lacking individual or all possible combinations of APP family members to assess potential functional redundancies within the gene family. Mice deficient for the nervous system-specific APLP1 protein showed a postnatal growth deficit as the only obvious abnormality. In contrast to this minor phenotype, APLP2(-/-)/APLP1(-/-) and APLP2(-/-)/APP(-/-) mice proved lethal early postnatally. Surprisingly, APLP1(-/-)/APP(-/-) mice were viable, apparently normal, and showed no compensatory upregulation of APLP2 expression. These data indicate redundancy between APLP2 and both other family members and corroborate a key physiological role for APLP2. This view gains further support by the observation that APLP1(-/-)/APP(-/-)/APLP2(+/-) mice display postnatal lethality. In addition, they provide genetic evidence for at least some distinct physiological roles of APP and APLP2 by demonstrating that combinations of single knock-outs with the APLP1 mutation resulted in double mutants of clearly different phenotypes, being either lethal, or viable. None of the lethal double mutants displayed, however, obvious histopathological abnormalities in the brain or any other organ examined. Moreover, cortical neurons from single or combined mutant mice showed unaltered survival rates under basal culture conditions and unaltered susceptibility to glutamate excitotoxicity in vitro.


Figures

Fig. 1.
Fig. 1.
Disruption of the APLP1 gene by gene targeting in ES cells. Our targeting strategy was aimed at abolishing transcription and translation by generating an ∼8 kb genomic deletion comprising 2.5 kb of the putative promoter, the first exon containing the ATG translational start codon and genomic sequences containing ∼50% of the APLP1 coding region. Top, Genomic segment containing the APLP1 locus. Apart from the first and second exon the precise location of the other exons (Exn) was not mapped. The stippled box represents an arbitrary positioned exon corresponding to coding sequences around cDNA position 1000. Parentheses indicate a restriction site derived from one of two overlapping λ phages. Middle, Targeting vector pAPLP1-targ. Horizontal arrows indicate the direction of transcription. The hatched boxrepresents a HSV-TK gene. Bottom, The disrupted allele after homologous recombination. E,EcoRI; H, HindIII;K, KpnI; P,PstI; S, SacI;X, XhoI; neo-probe, 0.6 kbPstI/XbaI fragment of pGKneo; probe B, genomic 0.5 kb PstI fragment. Bracketsrepresent restriction sites that were destroyed during cloning.
Fig. 2.
Fig. 2.
Molecular validation of the APLP1 knock-out. Functional inactivation of the APLP1 gene was confirmed by a combination of Southern (A, B), Western (C), and Northern (D) blot analysis. Genomic tail DNA from F1 offspring of the germline chimera was digested with HindIII and hybridized with genomic probe B, as depicted in Figure 1. Note that wt animals show a single band of 18 kb, whereas in heterozygous APLP1 mutants an additional band of the expected size of 14 kb was detected (A). Intercrossing of these heterozygous animals lead to homozygous mutants (B), as judged by analysis of DNA from mouse embryonic fibroblasts (MEF). The respective genotype is depicted above the blots. Western blots (C) of wt and APLP1/− mice were prepared as described in Materials and Methods. Forty micrograms of brain extracts from two APLP1/− mice (lanes 1, 2), a wt APLP1+/+littermate (lane 3), and a 129 Sv(ev) wt mouse (lane 4) were separated on a 12% standard Lämmli gel. Incubation with APLP1-specific antiserum CT11 followed by anti-rabbit horseradish peroxidase-linked secondary antibody showed a set of APLP-1-specific bands of 85–100 kDa for wt brain homogenates. In contrast, brain homogenates from APLP1/− animals showed neither APLP1-specific bands of wt size nor any shorter polypeptides. The blot was developed with chemiluminescence reagents (ECL; Amersham). Marker proteins of the indicated sizes were from Bio-Rad (broad range rainbow markers). Total RNA was isolated from brain of either mutant or wt animals, and poly(A+) RNA was prepared from 120 μg of total RNA. Northern blot analysis (D) with an antisense RNA probe (cDNA position 1788–2360) lying downstream of the targeted deletion revealed a band of 2.4 kb on brain of wt animals, whereas no transcript was detected in organs from APLP1/− mutant animals. After autoradiography, filters were stripped and rehybridized with a GAPDH probe to monitor loading (bottom panel).
Fig. 3.
Fig. 3.
Western blot analysis of APP/APLP expression in single and double mutants. A, Total brains of newborn APP/− (lane 9), APLP2/− (lane 7), and wt (lane 8) mice and in addition brains of newborn mice generated by intercrossing heterozygous APP+/−/APLP1/−mice (lanes 1–6) were homogenized, and equal amounts of protein (20 μg/lane) were resolved on 8% PAA gels. From each blot the bottom half was cut off and probed with an Actin-specific antibody to monitor loading (second row of each panel).Top, Note that probing with an antiserum specific for APLP2 (D2II) showed no major alterations of APLP2 expression in animals of different APP/APLP1 genotype compared to wt levels (lane 8). Bottom, Probing with an APP-specific antibody (22C11) showed comparable amounts of total APP expression in APLP1/− (lanes 1, 2) and wt (lane 8) mice. The seemingly higher expression of APP in APLP2/−mice (lane 7) is attributable to unequal loading as evidenced by more intense actin staining. As expected, APP expression was abolished in APP/− single mutants (lane 9) and APP/−/APLP1/−double mutants (lanes 5, 6). Note that in heterozygous APP+/−/APLP1/−mice APP expression is reduced to ∼50%, arguing against a compensatory upregulation of APP expression. B, Total brains of newborn pups obtained from heterozygous APLP2+/−/APLP1/−intercrosses were homogenized, and equal amounts of protein (20 μg/lane) were separated on a 8% PAA gel. Top, Probing with an APP-specific antibody (22C11) showed similar amounts of total APP expression in both viable APLP1+/−/APLP2/−heterozygotes (lanes 3, 4) or in lethal APLP1/−/APLP2/−double knock-outs (lanes 5, 6), compared to the amount of APP expression in APLP2/− single mutants (lanes 1,2) or in a wt control (lane 7). Note that no significant compensatory upregulation of APP expression was found. Bottom, Probing with an antiserum specific for APLP1 (CT11) showed similar APLP1 expression levels in APLP2/−mice (lanes 1,2) compared to the wt control. Note that in heterozygous APLP1+/−/APLP2/−animals (lanes 3, 4) expression is reduced to ∼50% and abolished in APLP1/−/APLP2/−double mutants (lanes 5, 6). Genotypes of animals analyzed are as indicated above blot panels.
Fig. 4.
Fig. 4.
Characterization of mutants by immunocytochemistry on brain sections. Histological analysis of the cortex and hippocampus from age-matched newborn wild-type, APLP2/−, and double knock-out mice lacking either APLP2/APLP1 or APLP2/APP revealed no apparent anomalies in any of the mutants examined. Pictures show frontal sections of parietal cortex (a–d) and hippocampus (a′–d′) from wild-type (a), APLP2/−(b), APP/−/APLP2/−(c), and APLP1/−/APLP2/−(d) knock-out mice. Shown are Nissl stains and immunohistochemistry with antibodies directed against synaptophysin (Syn) and MAP-II, as well as TUNEL stains. Scale bars: d, d′, 50 μm (applies to all panels). The cortical layers are indicated as:MZ, marginal zone; CP, cortical plate;SP, subplate; IZ, intermediate zone. The hippocampal structures are indicated as follows: St.O, stratum oriens; P, CA1 pyramidal cells;St.R, stratum radiatum; St.M, stratum moleculare; DG, dentate gyrus granule cells. Thearrows mark apoptotic nuclei.
Fig. 5.
Fig. 5.
Ultrastructure of brainstem synapses from single or combined mutants. Comparison of the morphology of synapses in brainstem ultrathin sections from newborn mice revealed no obvious changes in the ultrastructure of the nerve terminals in mutant compared to wt mice. Shown are electron micrographs of representative active zones obtained from wt (A), APLP2/−/APP/−(B), and APLP2/−/APLP1/−(C) samples processed as described in Materials and Methods. At the presynaptic site mutants and control mice showed comparably sized vesicle clouds, including docked vesicles in close proximity to the membrane. Electron dense postsynaptic specializations were clearly detectable in both double mutants.
Fig. 6.
Fig. 6.
Viability of cortical neurons from single or combined mutants. Neuronal viability was similar to that of wt neurons in APLP2/− single mutants (A, B) or both types of double mutants.A,APLP2/−/APLP1/−double mutants. B,APLP2/−/APP/−double mutants. Cortical neurons were obtained from individual embryos, as described in Materials and Methods. Viable neurons were counted using gridded coverslips once at DIV 1 (set as 100%) and again on DIV 7. For each embryo ∼240–360 neurons were counted, and two or three embryos were analyzed for each genotype. Values represent mean neuron counts obtained for mice of the indicated genotypes ± SEM, normalized to initial values on DIV 1.
Fig. 7.
Fig. 7.
Susceptibility of neurons from single or combined mutants to glutamate excitotoxicity. Cortical neurons from single mutants, heterozygotes, or double mutants showed no difference in their resistance to glutamate toxicity compared to wt neurons. Primary cortical neurons of the indicated genotypes were cultivated for 15 d before they were treated with glutamate, and their survival was analyzed by MTT assays. A, B, Cultures were exposed to different glutamate concentrations (10, 25, 50, 100 μm) for 24 hr. C, D,Glutamate (50 μm) was applied for 1 and 3 hr. MTT measurements were performed immediately after the glutamate exposures. Neurons from embryos of the respective genotypes were generated as described in Materials and Methods.

References

    1. Banker G, Goslin K. Culturing nerve cells. MIT; Cambridge, MA: 1998.
    1. Daigle I, Li C. apl-1, a Caenorhabditis elegans gene encoding a protein related to the human beta-amyloid protein precursor. Proc Natl Acad Sci USA. 1993;90:12045–12049. - PMC - PubMed
    1. Fox WM. Reflex-ontogeny and behavioural development of the mouse. Anim Behav. 1965;13:234–241. - PubMed
    1. Furukawa K, Mattson MP. Secreted amyloid precursor protein alpha selectively suppresses N-methyl-d-aspartate currents in hippocampal neurons: involvement of cyclic GMP. Neuroscience. 1998;83:429–438. - PubMed
    1. Furukawa K, Barger SW, Blalock EM, Mattson MP. Activation of K+ channels and suppression of neuronal activity by secreted beta-amyloid-precursor protein. Nature. 1996;379:74–78. - PubMed

Publication types

MeSH terms

LinkOut - more resources