. 2000 Nov 1;20(21):7978-85.
doi: 10.1523/JNEUROSCI.20-21-07978.2000.

In situ Ca2+ imaging reveals neurotransmitter receptors for glutamate in taste receptor cells

Affiliations

In situ Ca2+ imaging reveals neurotransmitter receptors for glutamate in taste receptor cells

A Caicedo et al. J Neurosci. .

Abstract

The neurotransmitters at synapses in taste buds are not yet known with confidence. Here we report a new calcium-imaging technique for taste buds that allowed us to test for the presence of glutamate receptors (GluRs) in living isolated tissue preparations. Taste cells of rat foliate papillae were loaded with calcium green dextran (CaGD). Lingual slices containing CaGD-labeled taste cells were imaged with a scanning confocal microscope and superfused with glutamate (30 micromter to 1 mm), kainate (30 and 100 micrometer), AMPA (30 and 100 micrometer), or NMDA (100 micrometer). Responses were observed in 26% of the cells that were tested with 300 micrometer glutamate. Responses to glutamate were localized to the basal processes and cell bodies, which are synaptic regions of taste cells. Glutamate responses were dose-dependent and were induced by concentrations as low as 30 microm. The non-NMDA receptor antagonists CNQX and GYKI 52466 reversibly blocked responses to glutamate. Kainate, but not AMPA, also elicited Ca(2+) responses. NMDA stimulated increases in [Ca(2+)](i) when the bath medium was modified to optimize for NMDA receptor activation. The subset of cells that responded to glutamate was either NMDA-unresponsive (54%) or NMDA-responsive (46%), suggesting that there are presumably two populations of glutamate-sensitive taste cells-one with NMDA receptors and the other without NMDA receptors. The function of GluRs in taste buds is not yet known, but the data suggest that glutamate is a neurotransmitter there. GluRs in taste cells might be presynaptic autoreceptors or postsynaptic receptors at afferent or efferent synapses.


Figures
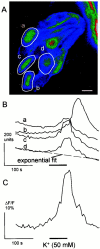
Fig. 1.
Fig. 1.
Example of Ca2+microfluorometric recordings, illustrating how data were processed in this study. A, Confocal image of a taste bud loaded with calcium green dextran (CaGD). The cell bodies of taste cells selected for measurements are encircled (a–d).B, Raw data from recordings of CaGD fluorescence from these four taste cells showing a response to KCl depolarization superimposed on a gradual decline in fluorescence over time (bleaching). The lowest trace (d) illustrates how an exponential fit was used to correct for this bleaching. The single exponential curve was fit to the first 120 sec and the last 30 sec of the recording. C, The exponential curve in the bottom trace in B(d) was subtracted from the recorded signal to correct for bleaching, and the fluorescence was expressed as ΔF/F. Scale bar, 10 μm.
Fig. 2.
Fig. 2.
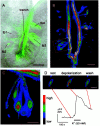
Foliate taste bud cells can be loaded with CaGD and visualized in slices of lingual epithelium. This figure shows confocal images of tissue slices (100 μm thick) from a foliate papilla that had been injected iontophoretically with CaGD, as described in Materials and Methods. CaGD is present in some taste buds and as an adhering layer to the superficial epithelium.A, Superimposed fluorescence and Nomarski differential interference contrast image. B, Fluorescent image alone from a different preparation. C, A higher magnification of the boxed region in B shows that five taste cells are loaded with CaGD. Apical processes extend to and converge at the taste pore. D, Ca2+response (ΔF/F) in a single taste cell from another preparation to depolarization with elevated K+ (50 mm) in the presence of 8 mm Ca2+ in the bath. Note that the response latency in this record and all subsequent figures is highly dependent on how deeply the imaged cell is situated within the tissue slice. In pseudocolor representations of raw images, redequals the highest fluorescence intensity. Scale bars:A, 50 μm; B, 20 μm; C, D, 10 μm.
Fig. 3.
Fig. 3.
Ca2+ responses to KCl depolarization depend on extracellular Ca2+.A, Ca2+ responses elicited by depolarization (elevated K+, 50 mm) were larger in 8 mm [Ca2+]othan in 2 mm [Ca2+]o.B, Mean Ca2+ responses from cells bathed in 8 mm [Ca2+]owere significantly larger than in cells bathed in 2 mm[Ca2+]o (*Student's ttest, p < 0.01). KCl responses were reversibly eliminated when Ca2+ was omitted from the bath.Numbers in parentheses equal the numbers of cells; error bars indicate SEM.
Fig. 4.
Fig. 4.
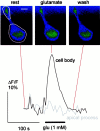
Ca2+ response to glutamate (1 mm) in a taste cell. The cell body (bottom) and the apical process (top) were selected for measurements (circles in the top left panel). In the cell body the peak amplitude of the response was 18% ΔF/F (dark trace). Note that the response declined while glutamate was still present. By contrast, the apical process did not respond to glutamate (light trace). In pseudocolor representations of raw images, green equals the highest fluorescence intensity. Scale bar, 10 μm.
Fig. 5.
Fig. 5.
Ca2+ responses to glutamate (1 mm) in KCl depolarization-sensitive and KCl depolarization-insensitive taste cells. A, Representative traces from three different taste cells stimulated sequentially with 1 mm glutamate (glu) and 50 mm KCl (K+). B, Summary of data from 82 cells, showing incidence of responses to glutamate and KCl (glu + K+) as ina, KCl alone (K+) as inb, glutamate alone (glu) as inc, and cells that did not respond either to KCl or glutamate (none).
Fig. 6.
Fig. 6.
Ca2+ responses to glutamate are localized to basal processes and cell bodies. A, Representative responses from one cell to 1 mm glutamate (glu) and 50 mm KCl (K+). This cell responded only to KCl depolarization; Ca2+ transients were recorded in the apical process, cell body, and basal process. B, Results from another cell that responded only to 1 mmglutamate and not to KCl depolarization. Note that responses to glutamate were restricted to the basal process and cell body in this cell.
Fig. 7.
Fig. 7.
Quantification and statistical analysis of results such as those illustrated in Figure 6. Taste cells were selected for this analysis according to the criteria described in Results. All basal processes (6 of 6) and 82% of the cell bodies responded to 300 μm glutamate (shaded bars), but only 28% (2 of 7) of the apical processes responded. The differences in the proportions of the responses between the apical process and the other cell regions were significant (Fisher Exact Test; *p < 0.05 for the difference between the apical process and the cell body and p < 0.01 for the difference between the apical process and the basal process). By contrast, KCl depolarization elicited Ca2+transients in all compartments (filled bars).
Fig. 8.
Fig. 8.
Ca2+ responses to glutamate are concentration-dependent. A, Peak amplitudes increased with increasing glutamate (glu) concentrations (from 30 μm to 1 mm). Traces from four different cells are superimposed and aligned at the initiation of the rising phase. B, Summary of concentration–response data for several experiments. Dotted line is the maximum ΔF/F baseline fluctuation (i.e., noise). Numbers in parentheses equal the numbers of cells; error bars indicate SEM.
Fig. 9.
Fig. 9.
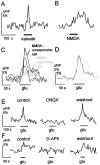
Taste cells responding to glutamate can be subdivided into NMDA-unresponsive and NMDA-responsive populations.A, B, Taste cells responded to kainate or to NMDA. Ca2+ responses to kainate (30 μm) were different from those to NMDA (100 μm with 100 μm glycine and 0 mm Mg2+). The response to kainate (A) was transient and recovered while kainate was still present. In another cell, NMDA induced a long-lasting response (B).C, Glutamate responses in NMDA-responsive cells were different from those in NMDA-unresponsive cells. NMDA-unresponsive cells (dark traces) showed large transient responses to glutamate (glu; 300 μm) compared with glutamate responses in NMDA-responsive cells (light traces). D, Normalized and averaged glutamate (300 μm) responses in NMDA-unresponsive cells (dark trace; n = 4 cells) and in NMDA-responsive cells (light trace;n = 4 cells). E, Glutamate responses in an NMDA-unresponsive cell were reversibly antagonized by the non-NMDA receptor antagonist CNQX (10 μm). CNQX was applied 5 min before and during stimulation with glutamate (glu; 300 μm). F, In an NMDA-responsive cell the glutamate responses (with 100 μm glycine and without Mg2+) were reversibly blocked by the NMDA receptor antagonist d-AP5 (50 μm).
Fig. 10.
Fig. 10.
Schematic drawings of the structure and putative synaptic connections of a taste bud. A, Fifty to 100 taste cells are grouped in a taste bud (only eight taste cells are shown). Taste receptor cells have apical processes that extend to and converge at the taste pore in the apical region. On their basal processes and cell bodies the taste cells form synaptic contacts with primary afferent fibers. B, Taste cells form synapses with primary sensory axons (a). Taste cells also may synapse with other taste cells within the taste buds (b). Furthermore, taste cells may receive efferent connections (c). The boxshown in B is enlarged at the right(a, c). The GluRs reported in this study may function at each of these sites (see Discussion).

References

    1. Akabas MH, Dodd J, Al-Awqati Q. A bitter substance induces a rise in intracellular calcium in a subpopulation of rat taste cells. Science. 1988;242:1047–1050. - PubMed
    1. Bernhardt S, Naim M, Zehavi U, Lindemann B. Changes in IP3 and cytosolic Ca2+ in response to sugars and non-sugar sweeteners in transduction of sweet taste in the rat. J Physiol (Lond) 1996;490:325–336. - PMC - PubMed
    1. Bigiani A, Delay RJ, Chaudhari N, Kinnamon SC, Roper SD. Responses to glutamate in rat taste cells. J Neurophysiol. 1997;77:3048–3059. - PubMed
    1. Bradley RM, King MS, Wang L, Shu X. Neurotransmitter and neuromodulator activity in the gustatory zone of the nucleus tractus solitarius. Chem Senses. 1996;21:377–385. - PubMed
    1. Caicedo A, Zucchi B, Roper SD. Gustatory neurons in the geniculate ganglion express AMPA and NMDA type glutamate receptors. Soc Neurosci Abstr. 1999;25:2183. - PubMed

Publication types

MeSH terms

LinkOut - more resources