. 2000 Nov 1;20(21):8188-98.
doi: 10.1523/JNEUROSCI.20-21-08188.2000.

Visual responses in monkey areas V1 and V2 to three-dimensional surface configurations

Affiliations

Visual responses in monkey areas V1 and V2 to three-dimensional surface configurations

J S Bakin et al. J Neurosci. .

Abstract

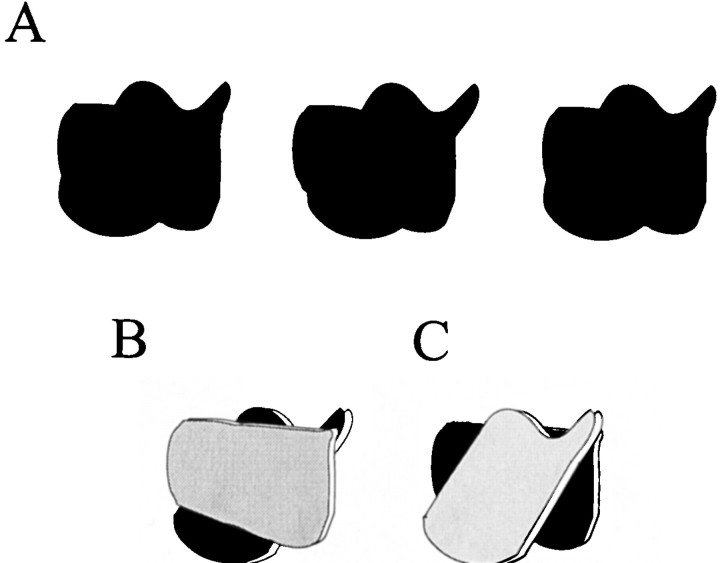
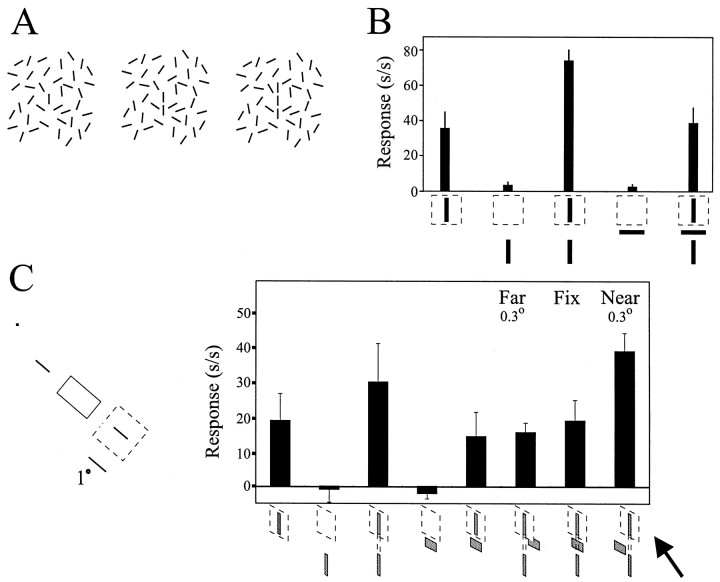
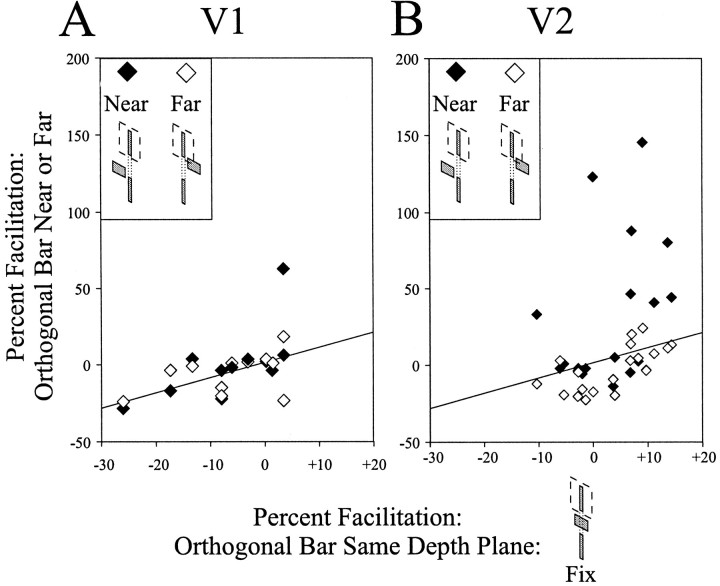
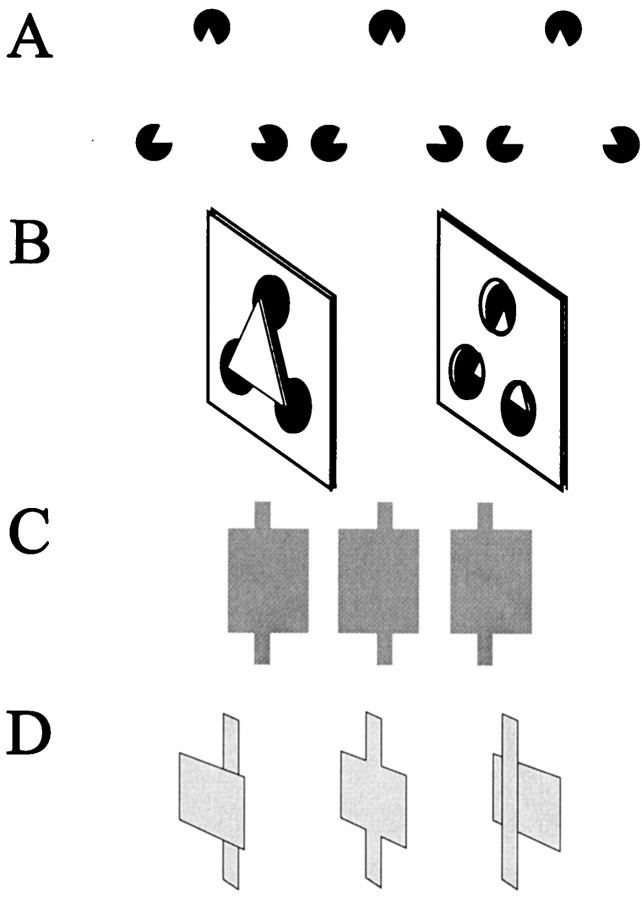
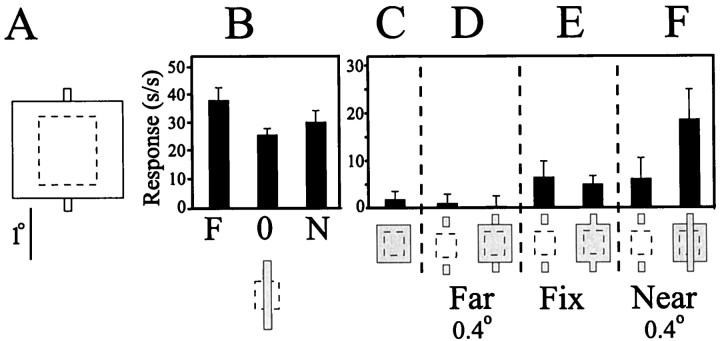
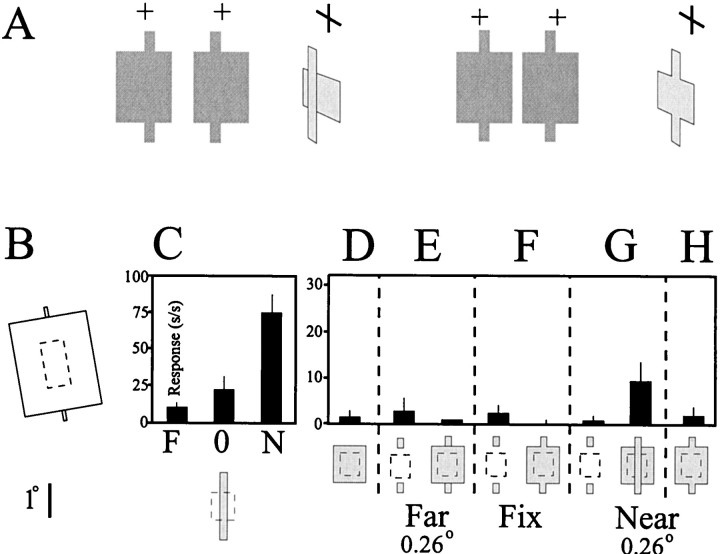
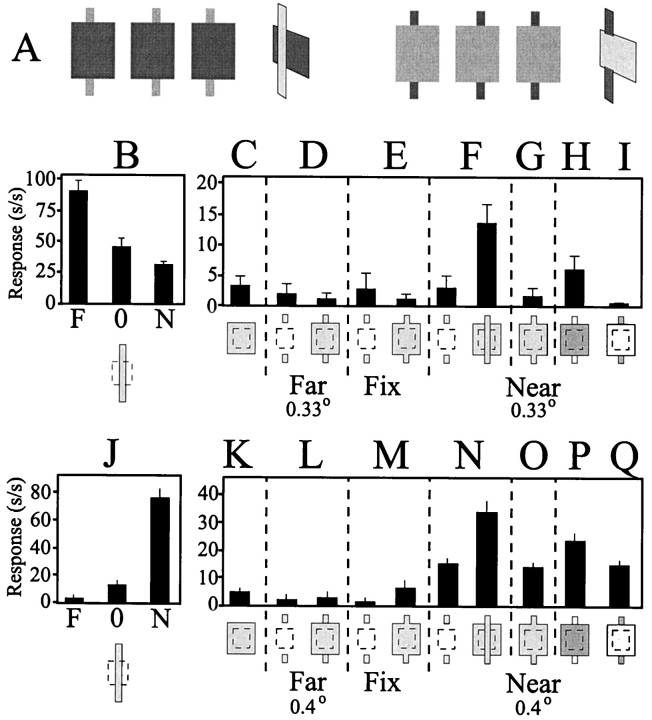
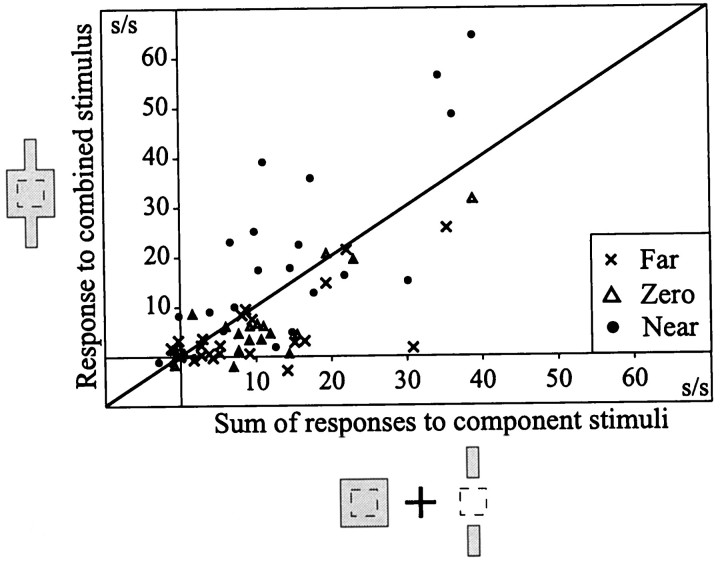
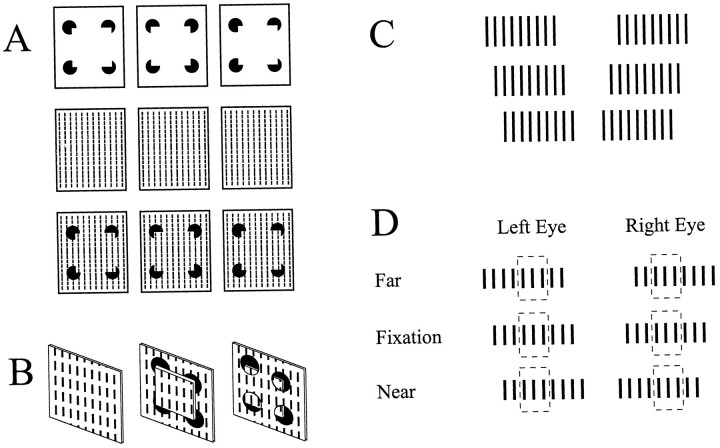
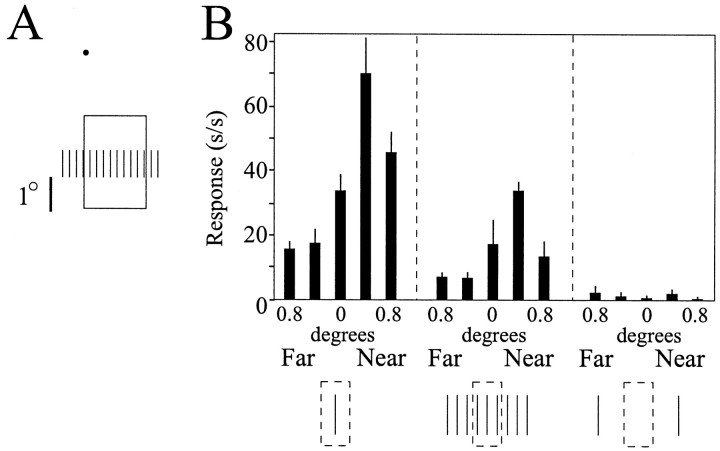
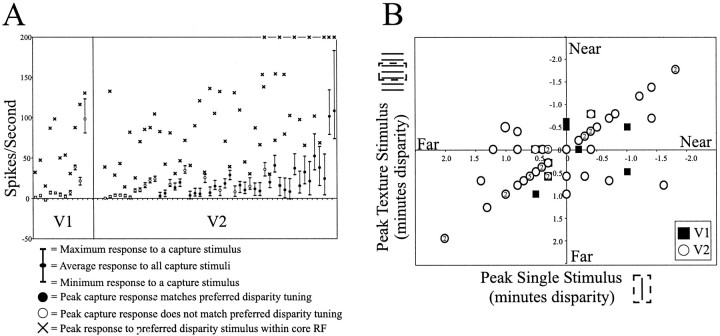
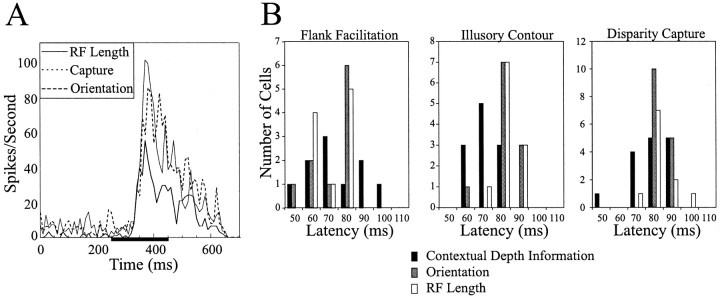
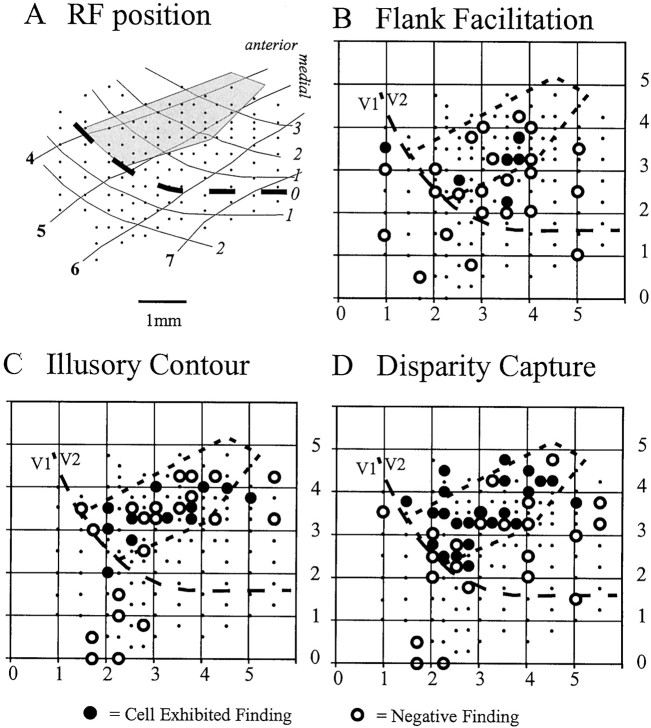
The visual system uses information about the relative depth of contours and surfaces to link and segment elements of visual scenes. The integration of form and depth information was studied in areas V1 and V2 of the alert macaque. Neurons in area V2 used contextual depth information to integrate occluded contours, signal the presence of object boundaries, and segment surfaces: (1) Amodal contour completion occurs when a contour passes behind an occluder. The basis of contour completion, the facilitation of neuronal responses to stimuli located within their receptive fields (RFs) by contextual lines lying outside their RFs, was blocked by orthogonal lines intersecting the contours but was recovered when the orthogonal line was placed in the near depth plane. (2) An illusory contour will modally complete separated elements located across an isoluminant field if the elements are placed in the near depth plane. V2 neurons responded when line segments were placed outside the RF in the near depth plane and a field of uniform luminance covered the RF. (3) Texture elements within a surface will "capture" the perceived depth consistent with the disparity of the surface's boundary, even when given no disparity themselves. V2 neurons responded to the center elements of a grating as if they contained disparity, even though disparity was present only for the grating's end elements located beyond the RF borders. These results, which were more common in V2 than in V1, demonstrate a role for V2 in the three-dimensional representation of surfaces in space.


Figures

Fig. 1.
Fig. 1.
Depth information, in the form of stimulus disparity, dictates how these ambiguous figures are interpreted.A–C, Stereograms of two ambiguous figures result in dramatic shifts of illusory contours and surface boundaries depending on the sign of the disparity. If the left andcenterimages in A are separately presented to the left and right eyes, respectively, a set of contours will be seen as in the diagram in B. If disparity is reversed by similarly fusing the center andrightimages, the contours will appear as in the diagram in C. If crossed disparity is given to the outer edges of the horizontally oriented shape, then it is perceived to appear in front of the plane of fixation and to occlude partially the vertically oriented shape located behind it (shading added for emphasis). Note that this requires the generation of illusory contours to bound the nearer object, as well as the linking of the two separated shapes behind the horizontal object into a single, unified vertical shape. Simply reversing the disparity of the edges results in a dramatic change in the percept; the vertical shape is now seen in front of the horizontal shape. This change in local disparity information forced a relocation of the illusory contours so that they now bounded the vertical shape in front (adapted from Nakayama et al., 1995).
Fig. 2.
Fig. 2.
A, Individual eyetraces indicating the horizontal eye positions of the right (top row) and the left (middle row)eyes obtained while the animal maintained fixation during presentation of a disparity capture grating located at 4° eccentricity which was given uncrossed (left column), zero(middle column), or crossed (right column) disparity. The solid horizontal barindicates the onset and duration of the stimulus presented in the near periphery. Note that stimulus onset did not result in any systematic shifts in eye position during stimulus presentation. The bottom row is eye vergence, or the difference in the eye position.B, Averaged horizontal eye position during 10 presentations each of nine disparities given to a single bar presented in the near periphery while the animal maintained eye fixation on a central fixation point. Note that vergence did not vary with the depth of the peripheral stimulus (filled circles). Moving the fixation point in depth did result in corresponding changes in eye vergence (open squares).
Fig. 3.
Fig. 3.
Physiologically defined visual maps. RF maps from each hemisphere were constructed that enabled the location of the V1 and V2 borders to be estimated. A, The reversal in visual field positions of RFs recorded from neurons establishes the location of the border between V1 and V2. Here, a map from the left hemisphere of one monkey is shown. Bold numbers indicate elevation (−4 to −7°), and italicizednumbers indicate azimuth (3, 2, 1, 0, 1, and 2°). B—D, A local clustering of larger RF sizes (B), greater direction preferences (C), and greater degrees of disparity modulation (D) suggest the possible location of a putative thick stripe. In the three maps of physiological properties shown, the larger the filledcircle, the larger the relative magnitude of the measured characteristic. We generated these maps by normalizing the magnitude of the recorded characteristic according to the minimum and maximum values obtained for each property. RF sizes ranged from 0.14 to 3.6 square degrees. Direction preference was the spike rate obtained in response to a stimulus of optimal orientation and size moving in the preferred direction divided by that obtained in response to the same stimulus moving in the opposite direction. This ratio ranged from 1 to 12.17. The disparity modulation ratio was calculated by dividing the spike rate obtained in response to a stimulus of optimal orientation, size, and disparity by the spike rate obtained in response to a stimulus of the same amount of disparity but different phase relationship (i.e., if the cell preferred a near stimulus of 1°, the response of the cell to the near 1° stimulus was divided by the response of the cell to a stimulus given 1° of far disparity). This ratio ranged from 1 to 35.4. Dashed line indicates V1/V2 border.
Fig. 4.
Fig. 4.
Flank facilitation signals stimulus contours.A, It is easier to detect a continuous contour composed of individual elements as the number of component elements increases.B, Adding colinear flanking lines outsideof the RF (dashed line-outlined square) core increases, or facilitates, the response of the neuron to a target stimulus locatedinside of the cell's RF. However, interrupting the path of the smooth contour by inserting a bar oriented orthogonal to the path of the contour blocks the flank-induced neural facilitation (adapted from Kapadia et al., 1995). In this, and all other quantified response plots, the response rate [spikes/second (s/s)] of the neuron is plotted on they-axis. C, Quantified responses recorded from a V2 neuron that exhibited flank facilitation are shown. Placing the orthogonal bar either in the same plane as the flank and target stimulus or in the far depth plane (0.16° uncrossed disparity) blocked the flank-induced facilitation of the neural response to the target stimulus. However, when the orthogonal bar was placed in the near depth plane (0.16° crossed disparity; arrow), the flank facilitated the neuron's response to the target stimulus, suggesting that flank facilitation can signal contours even when they are partially occluded. Fix refers to plane of fixation; dot in diagram at left is fixation plane.
Fig. 5.
Fig. 5.
Amount of facilitation produced by a contextual flank in the presence of an orthogonal bar as a function of the disparity of the orthogonal bar for cells in V1 (A)and V2 (B). The x-axis indicates the response of the cell in the presence of an orthogonal bar located in the same depth plane as the target and the flanking line. As observed previously, an orthogonal bar in the same depth plane as the target and flank blocks flank-induced facilitation; responses of most cells to the combined stimulus of a target and a flank were within 20% of the cell's response to the target alone, indicating that little facilitation was observed in this condition. To determine whether flank facilitation might recover during stimulus conditions analogous to occlusion, the depth of the orthogonal bar was varied. Quantified responses of neurons to near and far presentations of the orthogonal bar in conjunction with a target and a flanking line are plotted on they-axis. Data at or belowthe diagonal indicate that the orthogonal bar given disparity continued to block flank-induced facilitation. Dataabove the diagonal indicate that the orthogonal bar no longer blocked flank-induced facilitation. Thus, for each cell exhibiting flank-induced facilitation that was blocked by an orthogonal bar, we plotted two points: the facilitation observed with the orthogonal line in the near depth plane (filled diamonds) and the facilitation with the orthogonal line in the far depth plane (open diamonds). Facilitation was preserved in one V1 cell (left) and eight V2 cells (right) when the orthogonal bar was placed in the near plane (filled diamonds). No facilitation was observed when the orthogonal bar was placed in the far plane in V1 or V2(open diamonds).
Fig. 6.
Fig. 6.
A, Stereogram of a Kanisza triangle that demonstrates how global disparity information dictates a surface-based interpretation and determines the location and orientation of illusory contours. B, Diagram illustrating the stereogram in A. Depending on the depth projection of the triangle, the location and orientation of the illusory contours, and the triangular surface changes.C, Stereogram of simplified illusory contour stimulus used in this experiment. Note that all visual stimuli were of equal contrast and intensity. D, Diagram of the stereogram inC. Note that disparity was only provided to thetabs that extend beyond the larger square stimulus. During the experiment, the stimulus was sized and positioned such that the large square stimulus completely covered the RF core and thetabs were placed beyond the boundaries of the RF core.
Fig. 7.
Fig. 7.
Quantified responses to illusory contour stimuli.A, The stimulus configuration used in this experiment. The dashed line-outlined square indicates the minimal RF. B, Disparity responses of a V2 cell. This cell was classified a Far cell during the initial characterization of its response to disparity over a range of values covering ±1.5°. Three disparity values from this larger range were selected for use in this experiment [0.4° far (F), zero (0), and 0.4° near (N)]. The response of the neuron to a bar stimulus given those values of disparity and of equal length to the implied bar connected by the depth-defined illusory contours is illustrated. Over this range, the neuron showed a small preference for the far stimulus.C, The large square stimulus placed over the RF core (symbolized by the dashed line-outlined square) failed to drive the neuron. Note that the size and position of the square stimulus were chosen such that the ends of the field would extend beyond the RF core boundaries. In all cases, no disparity was provided to the large square stimulus. D, Placing the tabs in the far depth plane by adding uncrossed disparity did not drive the cell, when presented either alone (left) or in combination with the large square stimulus (right).E, Placing the tabs in the plane of fixation elicited a weak response from the cell (left). However, this response was not augmented when presented in combination with the large square stimulus (right). F, Placing the tabs in the near depth plane by adding crossed disparity resulted in a weak response from the cell when presented alone(left). However, when presented in combination with the large square stimulus (right), there was a substantial increase in the response of the cell, indicating a response to the depth-defined illusory contours that run between the contextual tabs placed outside of the RF core.
Fig. 8.
Fig. 8.
Illusory contours are induced by a relative depth step. A, Stereograms and diagrams illustrate the critical control condition in this experiment. Left, The relative disparity difference between the bar ends and the large field supports the percept of an illusory contour bounding a line segment located in front of a background square. Right, Removing the depth step between the large field and the contextual bar ends by providing equal disparity to the large field eliminates the perceived illusory contour.B, The stimulus configuration used in this experiment.C, Disparity-tuning curve for a tuned Near V2 cell. The response of the neuron to a bar of equal length as a depth-defined illusory contour stimulus given 0.26° of uncrossed, zero, or crossed disparity is illustrated. Over this range, the neuron showed a strong preference for the near stimulus. D, The large square stimulus placed over the RF core failed to drive the neuron. Note that the size and position of the square stimulus were chosen such that the ends of the field would extend beyond the RF core boundaries. Except for H, no disparity was provided to the large square stimulus. E, F, Placing the tabs in the far depth plane (E) or the plane of fixation (F) by adding appropriate disparity did not drive the cell, when presented either alone (left) or in combination with the large square stimulus (right).G, Placing the tabs in the near depth plane by adding crossed disparity did not drive the cell when presented alone(left). However, when presented in combination with the large square stimulus (right), there was a substantial increase in the response of the cell, indicating a response to the depth-defined illusory contours that run between the contextual tabs placed outside of the RF core. This increase in the response of the cell to the combined tab and square stimulus was nonlinear, because it was greater than the mathematical sum of the responses obtained when the tab ends were presented alone with crossed disparity (G, left) and the response of the neuron to the large square stimulus presented alone (D). H, Additional evidence that this increase in the response of the neuron was a response to the depth-defined illusory contour that crossed the RF is presented. The cell failed to respond when the large square stimulus was presented with an equal amount of crossed disparity, thereby eliminating the relative depth step between the large field and the contextual tabs and consequently eliminating the induced illusory contour.
Fig. 9.
Fig. 9.
V2 cells respond to Metelli color rules.A, Stereograms and diagrams of stimulus configurations that support the construction of illusory contours to form the boundaries of a transparent bar. The presence or absence of an illusory contour depends on the relative contrasts of the stimuli involved.Left, Presenting light tabs with crossed disparity and a darker large square supports the generation of a transparent bar (light vertical bar) bounded by illusory contours located infront of a backgroundfield. Right, On the other hand, reversing the contrast relationship generates a percept of two dark tabs hovering in front of a lighter background, with no illusory contours extending between the tabs. B—I, A V2 Far cell (stimulus orientation was 100°) that responds to the illusory contours generated either by an isoluminant stimulus configuration (F, right) or by the transparent stimulus configuration (H) in accordance with Metelli rules is shown. This cell does not respond when the relative stimulus contrast relationships do not support formation of an illusory contour. J—Q, This V2 Near cell (stimulus orientation was 40°) also responded to the illusory contour when the Metelli rules supported the formation of an illusory contour (N, P) but failed to show an enhanced response when the color conditions violated the Metelli rules (Q). Other figure conventions are as described in Figures 7 and 8.
Fig. 10.
Fig. 10.
V2 cells could signal modal completion. Scatter plot comparing the measured response of V2 cells to a complex stimulus consisting of a large field over the RF with zero disparity and two contextual bar ends given disparity versus the linear sum of the cell's response to the component stimuli presented in isolation. Cells respond greater than predicted when the contextual bar segments are given crossed (near; filled circles) disparity, suggesting that they can signal the existence of an illusory contour formed between the contextual bar segments. In contrast, cells do not respond with a greater firing rate than predicted when zero (triangles) or uncrossed (far;x's) disparity is added to the contextual bar segments located beyond the RF core. Note that each cell tested contributed three points to this scatter plot; one for each disparity condition.
Fig. 11.
Fig. 11.
Global depth information can influence the perception of local stimulus depth, as illustrated by disparity capture. A, Top row, An illusory squaregenerated by pac-man-like patterns can be perceived either in front of the plane of fixation or behind the plane of fixation through four small apertures, depending on the disparity provided by the pac-man supports. Similar to Figure 1, the location and orientation of the illusory contours vary depending on the surface interpretation dictated by the disparity cues. Middle row, A texture composed of individual vertical line segments presented with zero disparity is perceived to lie on the plane of fixation. Bottom row, Disparity capture occurs when the elements within the illusory squareassume the disparity values dictated by the surface interpretation demanded by the global disparity present in the pac-man supports.B, Diagram representing the percepts obtained by fusing the stereograms in A. In the middle, individual texture elements within the illusory squareare perceived to lie on the square, infront of a background texture of similar elements. On the right, elements within the aperture are perceived to lie on the square's surface, behind a foreground texture. In both cases, however, the individual texture elements contain zero disparity and would be perceived as lying in the plane of fixation if the global disparity information present in the pac-man supports was not present (left). C, A simplified disparity capture stimulus used in this experiment. D, Diagram of stimulus geometry with respect to the neuron's RF core (dashed line-outlined squares). Note that there are perfectly matched elements within each RF core, which would suggest that those stimulus elements should be fused with zero disparity. However, stimulus elements at the end of each grating would not have a matched pair; thus there would be disparity at the ends of the grating.
Fig. 12.
Fig. 12.
V2 cells respond to a disparity capture stimulus.A, Geometric layout of the stimulus with respect to the V2 cell's RF core. Note that the ends of the stimulus grating are located well outside of the cell's RF core. B,Quantified responses of a V2 cell during presentation of a disparity capture stimulus. Open symbols are plotted on the left-hand axis; filled symbols are plotted on the right-hand axis. Note that the cell responded to the disparity capture stimulus (filled circles) with the same response profile that it had to a single bar given disparity located in the middle of the RF core (open squares). Furthermore, note that the cell did not respond to the end lines of the gratings given disparity when presented alone (open triangles).
Fig. 13.
Fig. 13.
A second V2 cell showing disparity capture.A, Geometric relationship of the stimulus to the RF core. B, Quantified responses of the cell to a single bar given disparity located within the RF (left), to the disparity capture grating (middle), and to the ends of the grating stimulus presented alone and given disparity(right). Note that the cell responds similarly to the single bar given disparity and to the disparity capture grating, even though the line segments located within the RF core carry no explicit disparity information for the latter stimulus. Finally, this cell did not respond when isolated stimuli were given disparity and located at the same position as the ends of the disparity capture grating.
Fig. 14.
Fig. 14.
A, Response modulation of cells in V1 (left) and V2 (right) to contextual disparity. Each cell was tested with five grating stimuli, each containing a different amount of disparity limited to the ends of the grating located beyond the cell's core RF (2y, 1y, 0y, −1y, and −2y, where the disparity y is selected depending on the neuron's own disparity tuning). End points of the vertical lines indicate the maximum and minimum responses of the cell to the grating stimulus, with a circle indicating the cell's average response obtained by averaging responses to all five disparity conditions tested. The x's indicate the cell's maximum response rate to a single stimulus containing disparity presented within the cell's core RF and therefore provide a basis to compare the relative driving of the cell in response to the grating stimulus containing contextual disparity. B, Peak disparity tuning obtained by disparity capture grating and a single stimulus within the RF core. Plotting the disparity values that elicited the maximal response rate from the recorded neuron in response to the disparity capture grating versus the response rate obtained to a single stimulus given disparity reveals the high degree of similarity between the two response profiles. Pointsalong the diagonal indicate cells that responded maximally when the grating and the single bar stimulus had the same amount of disparity. These cells are indicated inA by the filled circles (29 of 47 or 62%). When present, numberswithin thecircles indicate how many cells had similar values for the peak disparity response (circleswithoutnumbers indicate single cases with those disparity values).
Fig. 15.
Fig. 15.
A, Peristimulus time histograms obtained for three experiments from a single V2 cell: RF length determination, orientation tuning, and disparity capture. Plotted are the responses to the optimal stimulus for each experiment.Horizontal bar on x-axis represents time of stimulus presentation. Note that the latency to response onset and the duration of the response are the same for all three experiments.B, Distributions of response latencies for all cells recorded from one monkey in response to the three experiments described in the paper are plotted along with the latency distributions obtained from the same cells in response to stimuli consisting of either optimal orientation or RF length. There is no difference between the distributions of neural latency obtained in response to stimuli containing contextual depth information presented beyond the RF core and the distributions obtained in response to preferred stimuli presented within the RF core.
Fig. 16.
Fig. 16.
Spatial distribution of cells responsive to contextual depth information. A, Map indicating the presumed location of a thick stripe (shaded area) in V2 of a single hemisphere based on the local clustering of cells with high degrees of binocularity, disparity selectivity, and motion/direction preference (these data are from the same hemisphere depicted in Fig.3B–D). B,Filled circles indicate the location of cells in this monkey that exhibited depth-gated flank facilitation. C,Filled circles indicate the location of cells in this monkey that responded to contextual depth-induced illusory contours.D,Filled circles indicate the location of cells in this monkey that exhibited disparity capture. In all cases,open circles indicate cells that were tested but failed to respond to the contextual stimulus plotted. Thick dashed line indicates V1/V2 boundary. Thin dashed-enclosed area indicates putative thick stripe.

References

    1. Allman JM, Miezin F, McGuiness E. Directions and velocity specific surround in three cortical visual areas of the owl monkey. Perception. 1985;14:105–126. - PubMed
    1. Barlow HB, Blakemore C, Pettigrew JD. The neural mechanism of binocular depth discrimination. J Physiol (Lond) 1967;193:327–342. - PMC - PubMed
    1. Bishop PO. Seeing with two eyes. Aust J Sci. 1970;32:383–391.
    1. Bishop PO. Neurophysiology of binocular single vision and stereopsis. In: Jung R, editor. Central processing of visual information. A: Integrative functions and comparative data. Springer; Heildelberg: 1973. pp. 255–305.
    1. Bishop PO. Stereopsis and fusion. Trans Ophthalmol Soc N Z. 1974;26:17–27. - PubMed

Publication types

LinkOut - more resources