

Impact of a Permo-Carboniferous high O2 event on the terrestrial carbon cycle
- PMID: 11050154
- PMCID: PMC18779
- DOI: 10.1073/pnas.220280097
Impact of a Permo-Carboniferous high O2 event on the terrestrial carbon cycle
Abstract
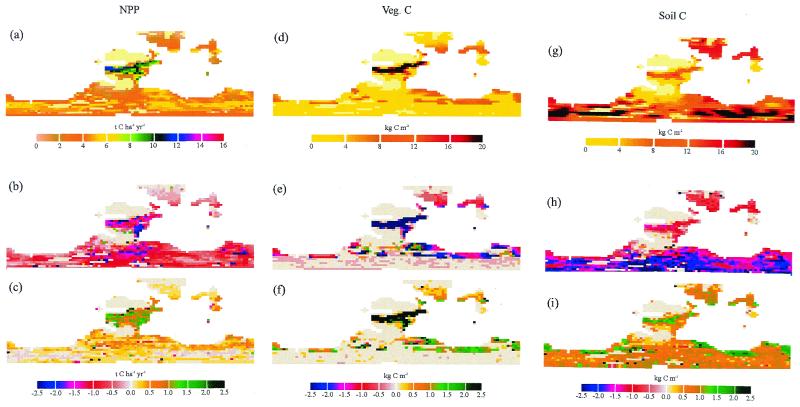
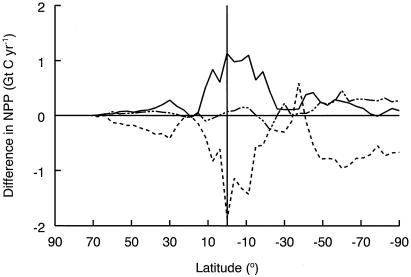
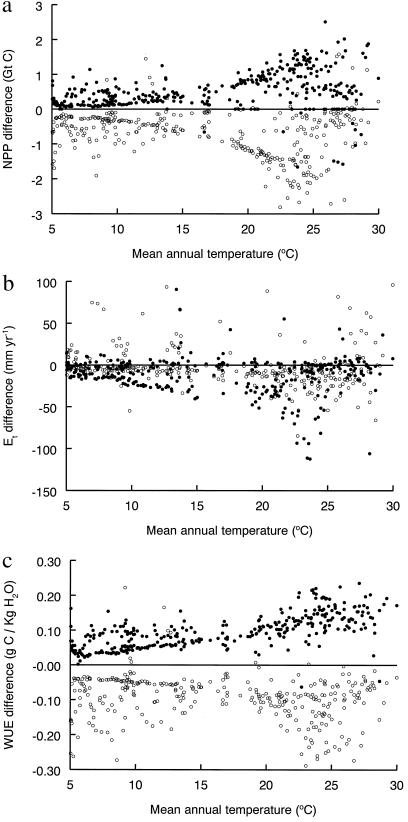
Independent models predicting the Phanerozoic (past 600 million years) history of atmospheric O(2) partial pressure (pO(2)) indicate a marked rise to approximately 35% in the Permo-Carboniferous, around 300 million years before present, with the strong potential for altering the biogeochemical cycling of carbon by terrestrial ecosystems. This potential, however, would have been modified by the prevailing atmospheric pCO(2) value. Herein, we use a process-based terrestrial carbon cycle model forced with a late Carboniferous paleoclimate simulation to evaluate the effects of a rise from 21 to 35% pO(2) on terrestrial biosphere productivity and assess how this response is modified by current uncertainties in the prevailing pCO(2) value. Our results indicate that a rise in pO(2) from 21 to 35% during the Carboniferous reduced global terrestrial primary productivity by 20% and led to a 216-Gt (1 Gt = 10(12) kg) C reduction in the vegetation and soil carbon storage, in an atmosphere with pCO(2) = 0.03%. However, in an atmosphere with pCO(2) = 0.06%, the CO(2) fertilization effect is larger than the cost of photorespiration, and ecosystem productivity increases leading to the net sequestration of 117 Gt C into the vegetation and soil carbon reservoirs. In both cases, the effects result from the strong interaction between pO(2), pCO(2), and climate in the tropics. From this analysis, we deduce that a Permo-Carboniferous rise in pO(2) was unlikely to have exerted catastrophic effects on ecosystem productivity (with pCO(2) = 0.03%), and if pCO(2) levels at this time were >0.04%, the water-use efficiency of land plants may even have improved.
Figures
Similar articles
-
Low atmospheric CO(2) levels during the Permo- Carboniferous glaciation inferred from fossil lycopsids.Proc Natl Acad Sci U S A. 2002 Oct 1;99(20):12567-71. doi: 10.1073/pnas.202304999. Epub 2002 Sep 16. Proc Natl Acad Sci U S A. 2002. PMID: 12235372 Free PMC article.
-
Forests, carbon and global climate.Philos Trans A Math Phys Eng Sci. 2002 Aug 15;360(1797):1567-91. doi: 10.1098/rsta.2002.1020. Philos Trans A Math Phys Eng Sci. 2002. PMID: 12460485 Review.
-
Europe-wide reduction in primary productivity caused by the heat and drought in 2003.Nature. 2005 Sep 22;437(7058):529-33. doi: 10.1038/nature03972. Nature. 2005. PMID: 16177786
-
Traceable components of terrestrial carbon storage capacity in biogeochemical models.Glob Chang Biol. 2013 Jul;19(7):2104-16. doi: 10.1111/gcb.12172. Epub 2013 Mar 25. Glob Chang Biol. 2013. PMID: 23505019
-
[Effects of land use change on carbon storage in terrestrial ecosystem].Ying Yong Sheng Tai Xue Bao. 2003 Aug;14(8):1385-90. Ying Yong Sheng Tai Xue Bao. 2003. PMID: 14655381 Review. Chinese.
Cited by
-
Land plants equilibrate O2 and CO2 concentrations in the atmosphere.Photosynth Res. 2006 Feb;87(2):177-94. doi: 10.1007/s11120-005-8388-2. Epub 2006 Jan 17. Photosynth Res. 2006. PMID: 16432665 Review.
-
Transcriptome enhanced rice grain metabolic model identifies histidine level as a marker for grain chalkiness.Sci Rep. 2025 May 12;15(1):16432. doi: 10.1038/s41598-025-00504-6. Sci Rep. 2025. PMID: 40355482 Free PMC article.
-
A revised view on the evolution of glutamine synthetase isoenzymes in plants.Plant J. 2022 May;110(4):946-960. doi: 10.1111/tpj.15712. Epub 2022 Mar 9. Plant J. 2022. PMID: 35199893 Free PMC article.
-
Photosynthetic water oxidation at elevated dioxygen partial pressure monitored by time-resolved X-ray absorption measurements.Proc Natl Acad Sci U S A. 2008 Nov 11;105(45):17384-9. doi: 10.1073/pnas.0802596105. Epub 2008 Nov 5. Proc Natl Acad Sci U S A. 2008. PMID: 18987324 Free PMC article.
-
Mercury isotopes show vascular plants had colonized land extensively by the early Silurian.Sci Adv. 2023 Apr 28;9(17):eade9510. doi: 10.1126/sciadv.ade9510. Epub 2023 Apr 28. Sci Adv. 2023. PMID: 37115923 Free PMC article.
References
-
- Holland H D. The Chemistry of the Atmosphere and Oceans. New York: Wiley; 1978.
-
- Berner R A, Canfield D E. Am J Sci. 1989;289:333–361. - PubMed
-
- Robinson J M. Palaeogeogr Palaeoclimatol Palaeoecol. 1989;75:223–240.
-
- Berner R A, Petsch S T, Lake J A, Beerling D J, Popp B N, Lane R S, Laws E A, Westerley M B, Cassar N, Woodward F I, et al. Science. 2000;287:1630–1633. - PubMed
LinkOut - more resources
Full Text Sources
Miscellaneous
