

Beryllium presentation to CD4+ T cells underlies disease-susceptibility HLA-DP alleles in chronic beryllium disease
- PMID: 11050177
- PMCID: PMC18830
- DOI: 10.1073/pnas.220430797
Beryllium presentation to CD4+ T cells underlies disease-susceptibility HLA-DP alleles in chronic beryllium disease
Abstract
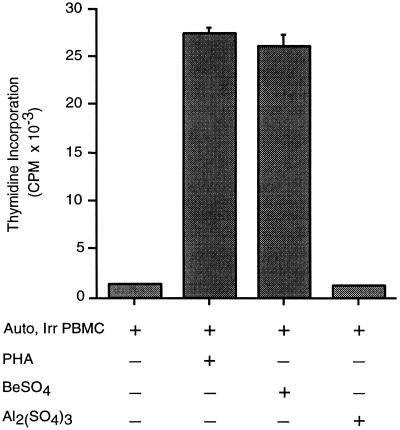
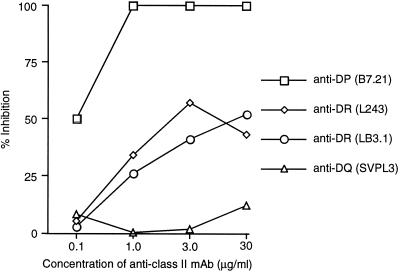
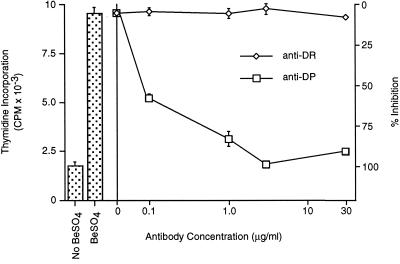
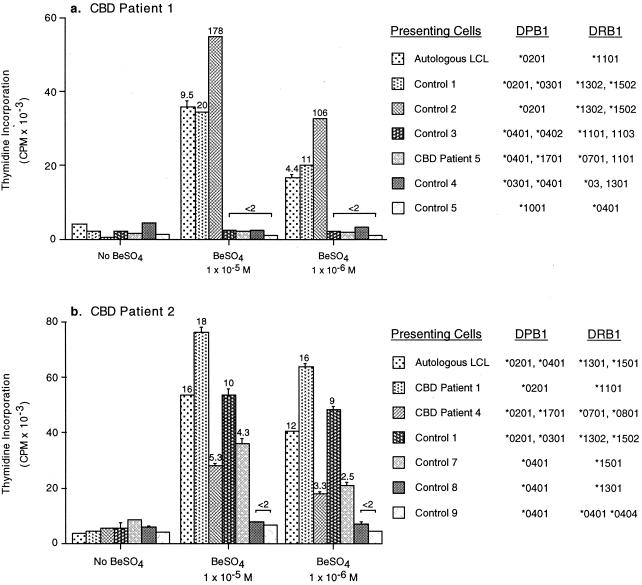
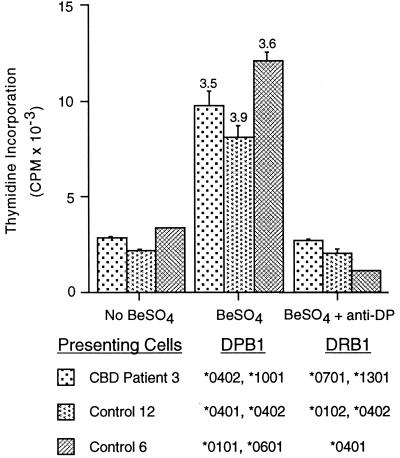
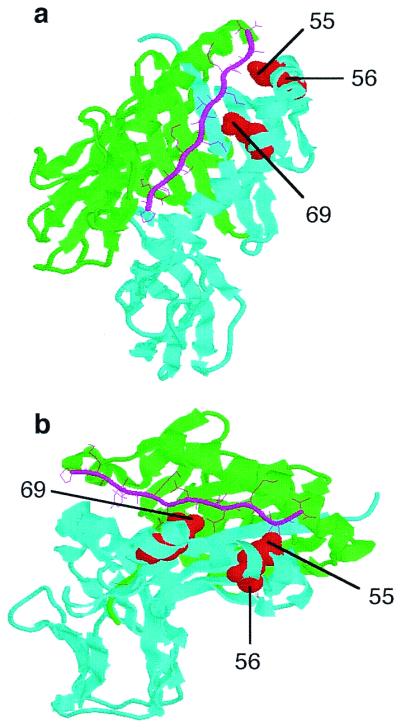
Chronic beryllium disease results from beryllium exposure in the workplace and is characterized by CD4(+) T cell-mediated inflammation in the lung. Susceptibility to this disease is associated with particular HLA-DP alleles. We isolated beryllium-specific T cell lines from the lungs of affected patients. These CD4(+) T cell lines specifically responded to beryllium in culture in the presence of antigen-presenting cells that expressed class II MHC molecules HLA-DR, -DQ, and -DP. The response to beryllium was nearly completely and selectively blocked by mAb to HLA-DP. Additional studies showed that only certain HLA-DP alleles allowed presentation of beryllium. Overall, the DP alleles that presented beryllium to disease-specific T cell lines match those implicated in disease susceptibility, providing a mechanism for this association. Based on amino acid residues shared by these restricting and susceptibility DP alleles, our results provide insight into the residues of the DP beta-chain required for beryllium presentation.
Figures
Similar articles
-
Chronic beryllium disease: T cell recognition of a metal presented by HLA-DP.Clin Immunol. 2001 Jul;100(1):4-14. doi: 10.1006/clim.2001.5053. Clin Immunol. 2001. PMID: 11414740 Review. No abstract available.
-
Beryllium presentation to CD4+ T cells is dependent on a single amino acid residue of the MHC class II beta-chain.J Immunol. 2005 Nov 15;175(10):7029-37. doi: 10.4049/jimmunol.175.10.7029. J Immunol. 2005. PMID: 16272364
-
Influence of MHC class II in susceptibility to beryllium sensitization and chronic beryllium disease.J Immunol. 2003 Dec 15;171(12):6910-8. doi: 10.4049/jimmunol.171.12.6910. J Immunol. 2003. PMID: 14662898
-
HLA-DP allele-specific T cell responses to beryllium account for DP-associated susceptibility to chronic beryllium disease.J Immunol. 2001 Mar 1;166(5):3549-55. doi: 10.4049/jimmunol.166.5.3549. J Immunol. 2001. PMID: 11207315
-
Linking genetic susceptibility and T cell activation in beryllium-induced disease.Proc Am Thorac Soc. 2010 May;7(2):126-9. doi: 10.1513/pats.201002-022RM. Proc Am Thorac Soc. 2010. PMID: 20427584 Free PMC article. Review.
Cited by
-
Chronic Beryllium Disease: revealing the role of beryllium ion and small peptides binding to HLA-DP2.PLoS One. 2014 Nov 4;9(11):e111604. doi: 10.1371/journal.pone.0111604. eCollection 2014. PLoS One. 2014. PMID: 25369028 Free PMC article.
-
4-1BB enhances proliferation of beryllium-specific T cells in the lung of subjects with chronic beryllium disease.J Immunol. 2008 Sep 15;181(6):4381-8. doi: 10.4049/jimmunol.181.6.4381. J Immunol. 2008. PMID: 18768897 Free PMC article.
-
Identification of beryllium-dependent peptides recognized by CD4+ T cells in chronic beryllium disease.J Exp Med. 2013 Jul 1;210(7):1403-18. doi: 10.1084/jem.20122426. J Exp Med. 2013. PMID: 23797096 Free PMC article.
-
Frequency of beryllium-specific, central memory CD4+ T cells in blood determines proliferative response.J Clin Invest. 2005 Oct;115(10):2886-93. doi: 10.1172/JCI24908. Epub 2005 Sep 8. J Clin Invest. 2005. PMID: 16151531 Free PMC article.
-
The uses and adverse effects of beryllium on health.Indian J Occup Environ Med. 2009 Aug;13(2):65-76. doi: 10.4103/0019-5278.55122. Indian J Occup Environ Med. 2009. PMID: 20386622 Free PMC article.
References
-
- Newman L S, Maier L A, Nemery B. In: Interstitial Lung Disease. Schwarz M I, King T E Jr, editors. Hamilton: Decker; 1998. pp. 367–392.
-
- Kreiss K, Wasserman S, Mroz M M, Newman L S. J Occup Med. 1993;35:267–274. - PubMed
-
- Kreiss K, Mroz M M, Zhen B, Martyny J W, Newman L S. Am Rev Respir Dis. 1993;148:985–991. - PubMed
-
- Kreiss K, Mroz M M, Newman L S, Martyny J, Zhen B. Am J Ind Med. 1996;30:16–25. - PubMed
-
- Richeldi L, Sorrentino R, Saltini C. Science. 1993;262:242–244. - PubMed
Publication types
MeSH terms
Substances
Grants and funding
LinkOut - more resources
Full Text Sources
Molecular Biology Databases
Research Materials
