

doi: 10.1073/pnas.230438697.
"Kiss and run" exocytosis at hippocampal synapses
Affiliations
- PMID: 11050187
- PMCID: PMC18849
- DOI: 10.1073/pnas.230438697
Item in Clipboard
"Kiss and run" exocytosis at hippocampal synapses
Proc Natl Acad Sci U S A.
.
Abstract
We have combined electrophysiology and imaging to measure the release of neurotransmitter and fluorescent dye at synapses of cultured hippocampal neurons. These experiments have revealed a "kiss and run" mode of exocytosis in which synaptic vesicles release glutamate normally but do not permit dye to enter or escape from the vesicle. During "kiss and run," the vesicle interior may be exposed very transiently (<6 ms), or a special configuration of the fusion pore may prevent dye exchange. We estimate that about 20% of the vesicles normally use this "kiss and run" pathway, and that the fraction of "kiss and run" events can be increased to over 80% by superfusing the synapses with hypertonic solution.
Figures
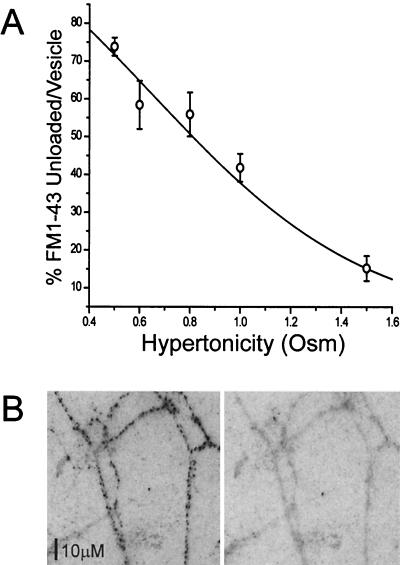
Increased osmolarities permit less dye release. (A)
Percent of FM1–43 that escapes per quantum of transmitter released by
hypertonic stimulation, relative to dye released per quantum with
action potentials, as a function of hypertonicity. Figure presents data
from 780 synapses in 8 experiments on conventional and microdot
cultures; error bars indicate one SEM. The smooth line is given by

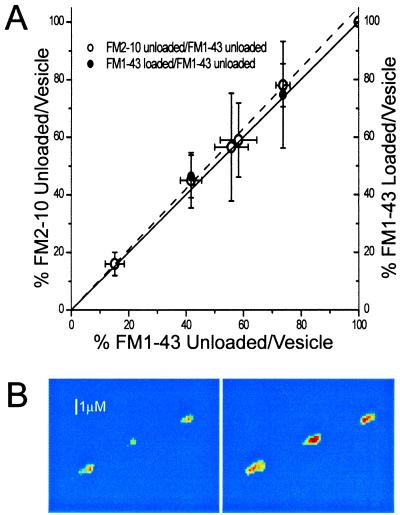
Two modes of exocytosis exist. (A) Percent FM2–10 and
FM1–43 released per quantum released (open circles) and percent
FM1–43 taken up per quantum released (filled circles) with
hypertonicity of solution as a parameter (Left to
Right), the hypertonicities are 1.5, 1.0, 0.8, 0.6, 0.5, and
0.0 (nerve impulse stimulation) osM. For example, the left-most point
is derived from experiments in which the release was produced by a
1.5-osM solution; the left ordinate value is the percentage dye release
from FM2–10 loaded synapses, and the abscissa value is the percent dye
released from FM1–43 loaded synapses. All percentage uptake and
release are relative to the dye released or taken up per quantum of
glutamate release produced by action potentials. Data for the abscissa
is from experiments of Fig. 1. FM2–10 dye release data from 365
synapses in 5 experiments and FM1–43 dye uptake data, from 520
synapses in 5 experiments; error bars indicate one SEM, with the larger
of the overlapping error bars associated with the filled circles (dye
uptake measurements have more error). The solid line has a slope of one
(equality for ordinate and abscissa), and the dotted line, with a slope
of 1.05, is the least squares fit to the data. (B)
Example of three synapses loaded with FM1–43 by 1 osM hypertonic
solution application (Left) and then (after prolonged
stimulation to release dye) by action potential stimulation
(Right); much less dye was loaded with hypertonic
stimulation, although in each case the preparation had been stimulated
to release the same amount of neurotransmitter. The images were
thresholded and false colored after subtraction of corresponding
nonspecific fluorescence remaining after prolonged stimulation. The
color map ranges from blue to red for increasing fluorescence and is
intended to show the relative difference between dye uptake with
hypertonic and action potential stimulation.
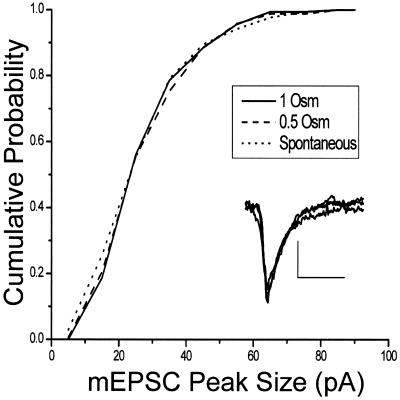
Neurotransmitter release is unchanged in “kiss and run.”
Cumulative histograms of peak mEPSC amplitudes in the presence of
bathing medium with hypertonicities of 0.0 osM (spontaneous mEPSCs,
dotted line, mean amplitude, 25.67 ± 1.13 pA,
n = 172), 0.5 osM (dashed, mean amplitude,
25.8 ± 1.15 pA, n = 166) and 1.0 osM (solid,
mean amplitude, 26.09 ± 0.98 pA, n = 182).
Inset shows averaged mEPSCs from the three conditions
superimposed. (Bar = 10 pA and 10 ms.)
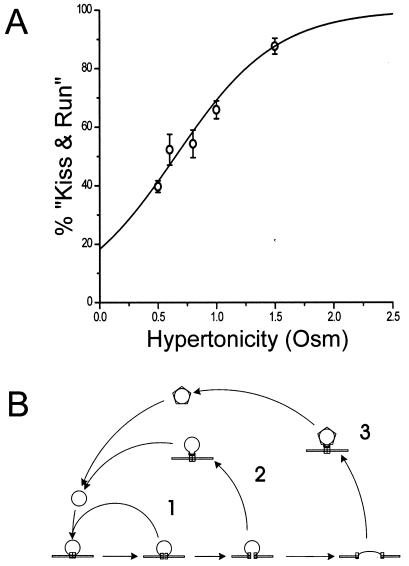
“Kiss and run” in normal synaptic transmission.
(A) Predicted and observed percentage of “kiss and
run” events as a function of hypertonicity. Theoretical function is
 ,
where h is the hypertonicity in osmolars, with a
= 2.3 and h0 = 0.65. Experimental
points are derived from those in Fig. 1. Note that p(0)
= 18.3%, which corresponds to the percentage of action
potential-evoked exocytotic events that are “kiss and run.”
(B) Cartoon of three pathways. (1) “Kiss and run,” in
which the fusion pore opens and then closes to return the vesicle to
its docked state intact; (2) rapid endocytosis that requires dynamin to
pinch the vesicle membrane off from the surface membrane, but not
clathrin; and (3) the classical endocytic pathway that requires both
dynamin and a clathrin coat that is removed after endocytosis.
,
where h is the hypertonicity in osmolars, with a
= 2.3 and h0 = 0.65. Experimental
points are derived from those in Fig. 1. Note that p(0)
= 18.3%, which corresponds to the percentage of action
potential-evoked exocytotic events that are “kiss and run.”
(B) Cartoon of three pathways. (1) “Kiss and run,” in
which the fusion pore opens and then closes to return the vesicle to
its docked state intact; (2) rapid endocytosis that requires dynamin to
pinch the vesicle membrane off from the surface membrane, but not
clathrin; and (3) the classical endocytic pathway that requires both
dynamin and a clathrin coat that is removed after endocytosis.
Similar articles
-
Vesicular release mode shapes the postsynaptic response at hippocampal synapses.J Physiol. 2009 Nov 1;587(Pt 21):5073-80. doi: 10.1113/jphysiol.2009.175315. Epub 2009 Sep 14. J Physiol. 2009. PMID: 19752123 Free PMC article.
-
Frequency-dependent kinetics and prevalence of kiss-and-run and reuse at hippocampal synapses studied with novel quenching methods.Neuron. 2006 Jan 19;49(2):243-56. doi: 10.1016/j.neuron.2005.12.018. Neuron. 2006. PMID: 16423698
-
Real-time three-dimensional tracking of single synaptic vesicles reveals that synaptic vesicles undergoing kiss-and-run fusion remain close to their original fusion site before reuse.Biochem Biophys Res Commun. 2019 Jun 30;514(3):1004-1008. doi: 10.1016/j.bbrc.2019.05.043. Epub 2019 May 12. Biochem Biophys Res Commun. 2019. PMID: 31092326
-
The synaptic vesicle cycle revisited.Neuron. 2000 Nov;28(2):317-20. doi: 10.1016/s0896-6273(00)00109-4. Neuron. 2000. PMID: 11144340 Review. No abstract available.
-
Regulation of exocytosis in neurons and neuroendocrine cells.Curr Opin Neurobiol. 2004 Oct;14(5):522-30. doi: 10.1016/j.conb.2004.08.008. Curr Opin Neurobiol. 2004. PMID: 15464884 Review.
Cited by
-
Presynaptic frequency- and pattern-dependent filtering.J Comput Neurosci. 2003 Sep-Oct;15(2):159-202. doi: 10.1023/a:1025812808362. J Comput Neurosci. 2003. PMID: 14512746 Review.
-
Fluorescence-based analysis of the intracytoplasmic membranes of type I methanotrophs.Microb Biotechnol. 2019 Sep;12(5):1024-1033. doi: 10.1111/1751-7915.13458. Epub 2019 Jul 1. Microb Biotechnol. 2019. PMID: 31264365 Free PMC article.
-
Synaptotagmin IV does not alter excitatory fast synaptic transmission or fusion pore kinetics in mammalian CNS neurons.J Neurosci. 2006 Jan 11;26(2):372-80. doi: 10.1523/JNEUROSCI.3997-05.2006. J Neurosci. 2006. PMID: 16407532 Free PMC article.
-
Cytosolic Accumulation of L-Proline Disrupts GABA-Ergic Transmission through GAD Blockade.Cell Rep. 2016 Oct 4;17(2):570-582. doi: 10.1016/j.celrep.2016.09.029. Cell Rep. 2016. PMID: 27705802 Free PMC article.
-
Exosome secretion kinetics are controlled by temperature.Biophys J. 2023 Apr 4;122(7):1301-1314. doi: 10.1016/j.bpj.2023.02.025. Epub 2023 Feb 22. Biophys J. 2023. PMID: 36814381 Free PMC article.
References
Publication types
MeSH terms
Substances
LinkOut - more resources
Full Text Sources
Other Literature Sources
Molecular Biology Databases
