Comparative Study
. 2000 Oct 24;97(22):11744-50.
doi: 10.1073/pnas.97.22.11744.

Mechanical bases of frequency tuning and neural excitation at the base of the cochlea: comparison of basilar-membrane vibrations and auditory-nerve-fiber responses in chinchilla

Affiliations
Comparative Study

Mechanical bases of frequency tuning and neural excitation at the base of the cochlea: comparison of basilar-membrane vibrations and auditory-nerve-fiber responses in chinchilla

M A Ruggero et al. Proc Natl Acad Sci U S A. .

Abstract

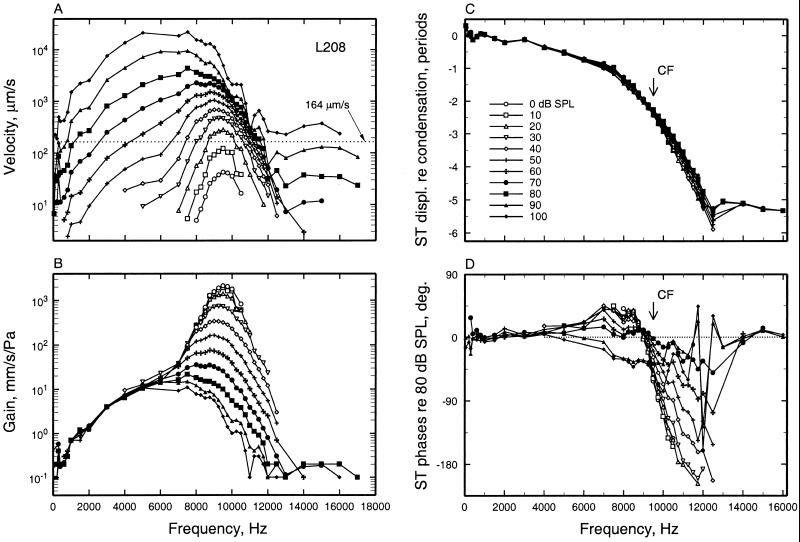
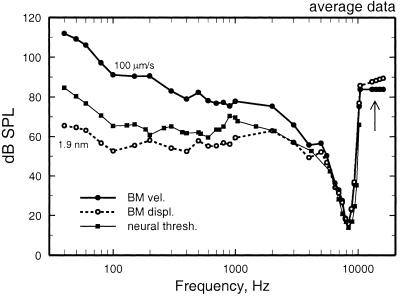
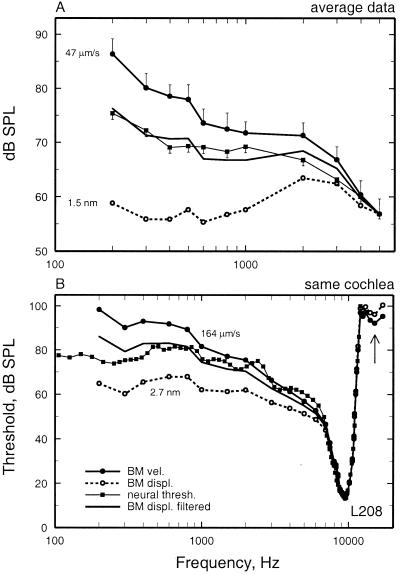
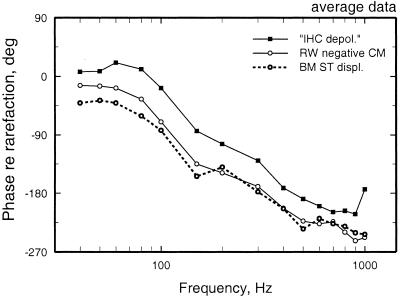
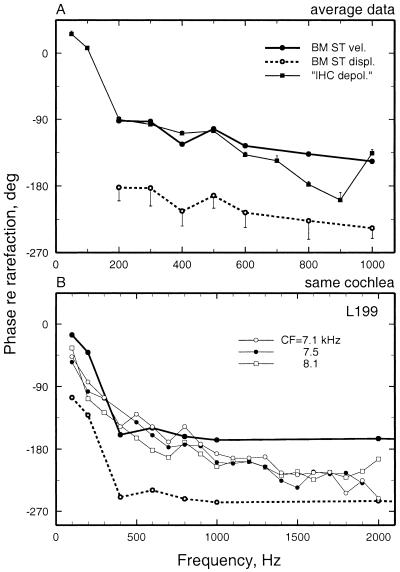
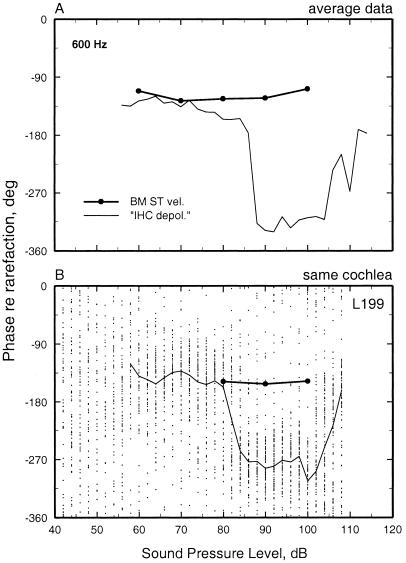
We review the mechanical origin of auditory-nerve excitation, focusing on comparisons of the magnitudes and phases of basilar-membrane (BM) vibrations and auditory-nerve fiber responses to tones at a basal site of the chinchilla cochlea with characteristic frequency approximately 9 kHz located 3.5 mm from the oval window. At this location, characteristic frequency thresholds of fibers with high spontaneous activity correspond to magnitudes of BM displacement or velocity in the order of 1 nm or 50 microm/s. Over a wide range of stimulus frequencies, neural thresholds are not determined solely by BM displacement but rather by a function of both displacement and velocity. Near-threshold, auditory-nerve responses to low-frequency tones are synchronous with peak BM velocity toward scala tympani but at 80-90 dB sound pressure level (in decibels relative to 20 microPascals) and at 100-110 dB sound pressure level responses undergo two large phase shifts approaching 180 degrees. These drastic phase changes have no counterparts in BM vibrations. Thus, although at threshold levels the encoding of BM vibrations into spike trains appears to involve only relatively minor signal transformations, the polarity of auditory-nerve responses does not conform with traditional views of how BM vibrations are transmitted to the inner hair cells. The response polarity at threshold levels, as well as the intensity-dependent phase changes, apparently reflect micromechanical interactions between the organ of Corti, the tectorial membrane and the subtectorial fluid, and/or electrical and synaptic processes at the inner hair cells.


Figures

Figure 1
Figure 1
The magnitudes and phases of BM responses to tones at the 3.5-mm site of the chinchilla cochlea. (A) Velocity magnitude as a function of stimulus frequency (abscissa) and level (parameter). The dotted line indicates the velocity corresponding to the CF threshold of the auditory-nerve fiber in Fig. 3B. (B) As in A, but normalized to stimulus pressure. (C) Response phases of peak displacement toward scala tympani, relative to peak condensation at the external ear canal, as a function of stimulus frequency and level. (D) As in C, but normalized to the phases of responses to 80-dB stimuli. Data from cochlea L208, recorded by using a laser vibrometer (59).
Figure 2
Figure 2
Frequency tuning of BM vibrations and auditory-nerve fibers at the 3.5-mm site of the chinchilla cochlea. An average frequency-threshold curve computed from responses of many auditory-nerve fibers is compared with the average tuning of BM responses in several cochleae, expressed as the stimulus levels at which BM vibration attains a displacement of 1.9 nm or a velocity of 100 μm/s. BM data were measured by using the Mössbauer technique. Redrawn from the data of figure 22 of Ruggero et al. (17).
Figure 3
Figure 3
Frequency tuning of BM vibrations and auditory-nerve fibers at the 3.5-mm site of the chinchilla cochlea. (A) An average frequency-threshold curve for auditory-nerve fibers is compared with the average tuning of BM responses in several cochleae, expressed as three curves indicating the stimulus levels at which BM vibration attains a displacement of 1.5 nm, a velocity of 47 μm/s, and a constant displacement high-pass filtered at a rate of 3.83 dB/octave. The three curves are equated to neural threshold at 5 kHz. BM data were measured in 18 cochleae by using laser velocimetry. The threshold averages of auditory-nerve fibers were based on data for 183 fibers with CF = 8–12 kHz recorded in 77 chinchillas. The data consisted of frequency-threshold tuning curves, measured with an automated adaptive algorithm (7, 60), and 0.5-s samples of responses to low-frequency tones (≤1 kHz) (9). Vertical bars indicate the SEM. (B) Frequency tuning of responses to tones of a BM site and an auditory-nerve fiber with similar characteristic frequency recorded in the same cochlea. The neural frequency-threshold tuning curve is compared with BM tuning curves indicating constant displacement (2.7 nm), constant velocity (164 μm/s), and displacement high-pass filtered at a rate of 3.81 dB/octave. The auditory-nerve fiber had spontaneous activity of 11.2 spikes/s. (B) Redrawn from figure 1B of Narayan et al. (8).
Figure 4
Figure 4
Average response phases of auditory-nerve fibers, cochlear microphonics (recorded at the round window), and BM displacement at the base of the chinchilla cochlea. Redrawn from the data of figure 5 of Ruggero et al. (16).
Figure 5
Figure 5
The phases of BM and auditory-nerve-fiber responses to low-frequency tones. (A) Average response phases of auditory-nerve fibers and BM vibrations at the base of the chinchilla cochlea. Neural data are averages from 13–52 fibers (depending on frequency) with CF 8–12 kHz. BM responses were measured in 8–18 cochleae (depending on frequency). Vertical bars indicate SEM. (B) The phases of responses to tones of a BM site and auditory-nerve fibers with similar CF recorded in the same cochlea. The auditory-nerve phases have been corrected for 1 ms (the sum of neural and synaptic delays) so that they indicate the presumed phases of peak depolarization of the inner hair cells (9). The same BM data are represented in two curves, depicting the phases of peak velocity toward scala tympani and of peak displacement toward scala tympani. Spontaneous rates were 105, 62, and 73 spikes/s, respectively. Thresholds at CF were 11, 4, and 1 dB SPL, respectively. Stimuli for the auditory-nerve fibers were 10 repetitions of 75-dB, 100-ms tone pips presented every 300 ms. The data points for BM phases represent averages for responses to 50–100 dB SPL, depending on frequency. Averaging is justified because, as shown in Fig. 6B, BM response phases did not vary significantly as a function of stimulus intensity.
Figure 6
Figure 6
The phases of BM and auditory-nerve-fiber responses to low-frequency tones as a function of stimulus level. (A) Average phases of responses to 600-Hz tones recorded at the BM of eight cochleae and from 27 auditory-nerve fibers with CF 8–12 kHz. (B) The responses to 600-Hz tones of a BM site and an auditory-nerve fiber (CF = 7. 1 kHz; spontaneous rate = 105 spikes/s) with similar CF recorded in the same cochlea. The phases of peak BM velocity toward scala tympani are indicated by ● connected by a thick line. The neural responses are depicted as a scatter diagram of phase vs. level, with each dot representing one spike. Stimuli were five repetitions of 100-ms tones, presented every 300 ms at random levels, with 2-dB steps. The mean phases of the neural responses are indicated by a thin line.

Similar articles

Cited by

References

    1. Spoendlin H. In: Physiology of the Ear. Jahn A F, Santos-Sacchi J, editors. New York: Raven; 1988. pp. 201–219.
    1. Hudspeth A J, Corey D P. Proc Natl Acad Sci USA. 1977;74:2407–2411. - PMC - PubMed
    1. Russell I J, Richardson G P, Cody A R. Nature (London) 1986;321:517–519. - PubMed
    1. Ruggero M A. In: Active Hearing. Flock A, Ottoson D, Ulfendahl M, editors. Oxford: Pergamon; 1995. pp. 321–336.
    1. Sellick P M, Patuzzi R, Johnstone B M. J Acoust Soc Am. 1982;72:131–141. - PubMed

Publication types

LinkOut - more resources