. 2000 Oct 24;97(22):11990-5.
doi: 10.1073/pnas.97.22.11990.

The structure of the chromophore within DsRed, a red fluorescent protein from coral

Affiliations

The structure of the chromophore within DsRed, a red fluorescent protein from coral

L A Gross et al. Proc Natl Acad Sci U S A. .

Abstract

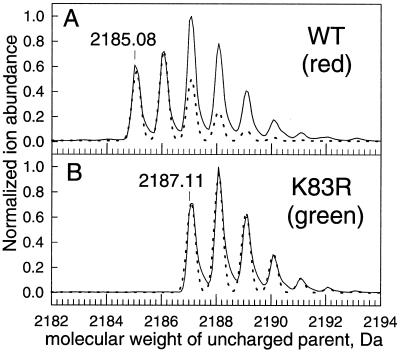
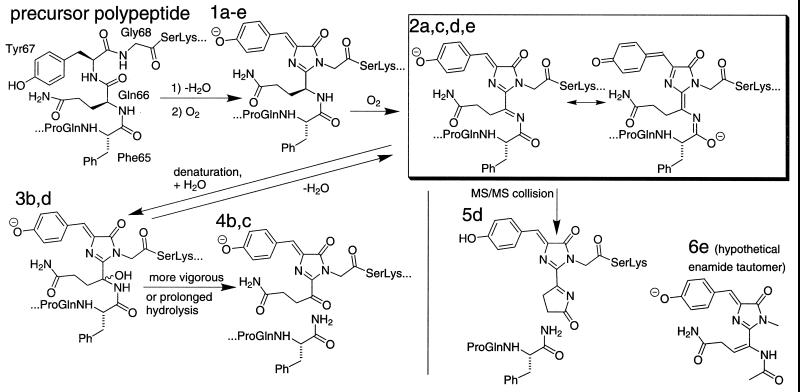
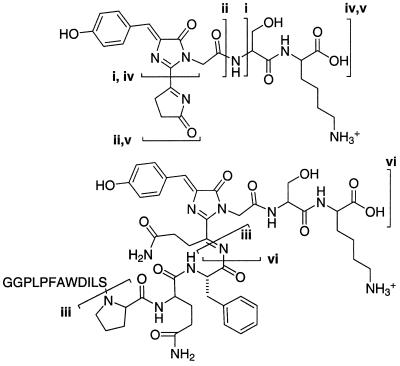
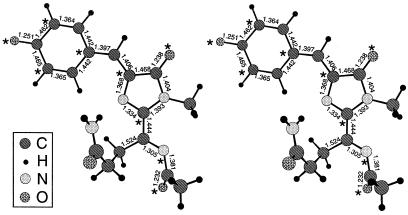
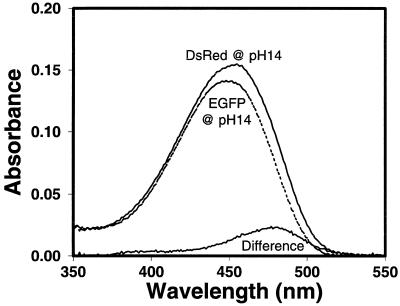
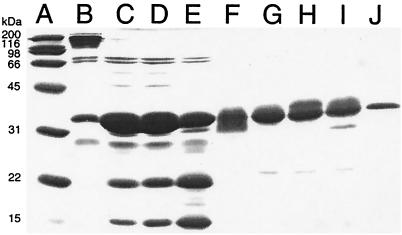
DsRed, a brilliantly red fluorescent protein, was recently cloned from Discosoma coral by homology to the green fluorescent protein (GFP) from the jellyfish Aequorea. A core question in the biochemistry of DsRed is the mechanism by which the GFP-like 475-nm excitation and 500-nm emission maxima of immature DsRed are red-shifted to the 558-nm excitation and 583-nm emission maxima of mature DsRed. After digestion of mature DsRed with lysyl endopeptidase, high-resolution mass spectra of the purified chromophore-bearing peptide reveal that some of the molecules have lost 2 Da relative to the peptide analogously prepared from a mutant, K83R, that stays green. Tandem mass spectrometry indicates that the bond between the alpha-carbon and nitrogen of Gln-66 has been dehydrogenated in DsRed, extending the GFP chromophore by forming C==N==C==O at the 2-position of the imidazolidinone. This acylimine substituent quantitatively accounts for the red shift according to quantum mechanical calculations. Reversible hydration of the C==N bond in the acylimine would explain why denaturation shifts mature DsRed back to a GFP-like absorbance. The C==N bond hydrolyses upon boiling, explaining why DsRed shows two fragment bands on SDS/PAGE. This assay suggests that conversion from green to red chromophores remains incomplete even after prolonged aging.


Figures

Figure 1
Figure 1
Mass spectra (solid lines) of HPLC-purified chromopeptides from LysC digests of denatured DsRed (A) and green mutant K83R (B). The dashed lines indicate the theoretical mass spectra for structures 2d and 1d considering the natural abundances of 13C, 2H, 15N, 17O, and 18O. The mass scale is for the uncharged parent species, deconvoluted from the +2 to +4 species (A) or +2 to +3 species (B). WT, Wild type.
Figure 2
Figure 2
Summary scheme for conversion of immature green form (1) to mature red form of DsRed (2) and reactions after denaturation of the latter. Letter suffixes denote different contexts for the same chromophore: (a) intact or (b) denatured protein with the N-terminal polyhistidine tag, (c) with that tag removed, (d) the HPLC-purified LysC proteolytic fragment derived from residues 51–70, and (e) a computational model where the aliphatic linkages to the rest of the protein have been replaced by methyls. Table 1 enumerates the interconversions and properties of the protein species and fragments.
Figure 3
Figure 3
Proposed structures for the more complex fragments of Table 1. Note that iii and v are the same as the two fragments in structure 5d of Fig. 2.
Figure 4
Figure 4
Computed ground-state structure of the DsRed chromophore 2e, shown as a stereo pair for viewing with uncrossed eyes. Symbols for C, H, N, and O are explained in the Inset. Relevant bond lengths are given in angstroms. Starred and unstarred atoms, respectively, indicate where maxima and nodes of the highest occupied molecular orbital should be located according to basic molecular orbital theory (15), in agreement with the far more detailed calculations presented in Fig. 7.
Figure 5
Figure 5
Absorbance spectra of DsRed (solid line, λmax 451.5 nm) and enhanced GFP (EGFP) (dashed line, λmax 446 nm), both 3.9 μM by BCA protein assay, denatured in 1 M NaOH. The difference between the DsRed and EGFP spectra also is indicated.
Figure 6
Figure 6
Oligomerization and cleavage of DsRed monitored by electrophoresis in a 15% polyacrylamide gel. Lane A: Broad range protein standard (Bio-Rad); molecular masses in kDa are indicated. Lane B: Unboiled DsRed (the band with molecular mass > 100 kDa was brightly red fluorescent before Coomassie staining). Lane C: Boiled DsRed. Lane D: DsRed boiled in 0.1 M KOH. Lane E: DsRed boiled in 0.1 M HCl. Lane F: Unboiled enhanced yellow fluorescent protein (EYFP) (the band with apparent molecular mass ≈ 30 kDa was brightly yellow fluorescent before Coomassie staining). Lane G: Boiled EYFP. Lane H: EYFP boiled in 0.1 M KOH. Lane I: EYFP boiled in 0.1 M HCl. Lane J: Boiled DsRed K83R. The two bands at ≈70 kDa in nearly every lane are non-GFP impurities we sometimes observe in protein preps from JM109 Escherichia coli.

References

    1. Baird G S, Zacharias D A, Tsien R Y. Proc Natl Acad Sci USA. 2000;97:11984–11989. - PMC - PubMed
    1. Matz M V, Fradkov A F, Labas Y A, Savitsky A P, Zaraisky A G, Markelov M L, Lukyanov S A. Nat Biotechnol. 1999;17:969–973. - PubMed
    1. Tsien R Y. Nat Biotechnol. 1999;17:956–957. - PubMed
    1. Niwa H, Inouye S, Hirano T, Matsuno T, Kojima S, Kubota M, Ohashi M, Tsuji F I. Proc Natl Acad Sci USA. 1996;93:13617–13622. - PMC - PubMed
    1. Frisch M J, Trucks G W, Schlegel H B, Scuseria G E, Robb M A, Cheeseman J R, Zakrzewski V G, Montgomery J A, Jr, Stratmann R E, Burant J C, et al. gaussian 98 Revision A.7. Pittsburgh: Gaussian; 1998.

Publication types