Comparative Study
. 2000 Oct 24;97(22):12002-7.
doi: 10.1073/pnas.97.22.12002.

Replication by a single DNA polymerase of a stretched single-stranded DNA

Affiliations
Comparative Study

Replication by a single DNA polymerase of a stretched single-stranded DNA

B Maier et al. Proc Natl Acad Sci U S A. .

Abstract

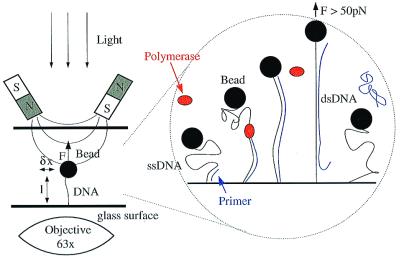
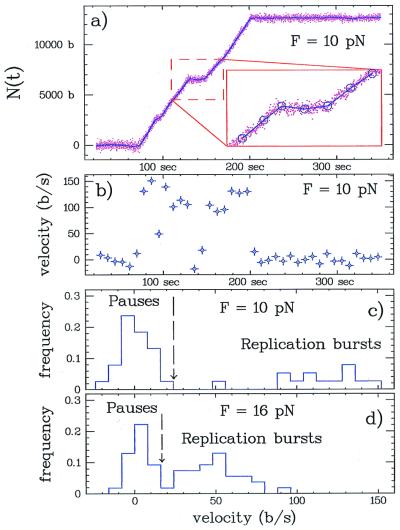
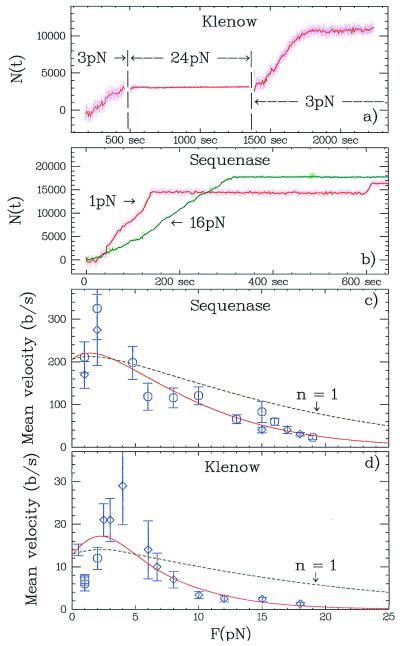
A new approach to the study of DNA/protein interactions has been opened through the recent advances in the manipulation of single DNA molecules. These allow the behavior of individual molecular motors to be studied under load and compared with bulk measurements. One example of such a motor is the DNA polymerase, which replicates DNA. We measured the replication rate by a single enzyme of a stretched single strand of DNA. The marked difference between the elasticity of single- and double-stranded DNA allows for the monitoring of replication in real time. We have found that the rate of replication depends strongly on the stretching force applied to the template. In particular, by varying the load we determined that the biochemical steps limiting replication are coupled to movement. The replication rate increases at low forces, decreases at forces greater than 4 pN, and ceases when the single-stranded DNA substrate is under a load greater than approximately 20 pN. The decay of the replication rate follows an Arrhenius law and indicates that multiple bases on the template strand are involved in the rate-limiting step of each cycle. This observation is consistent with the induced-fit mechanism for error detection during replication.


Figures

Figure 1
Figure 1
Sketch of the experimental system and the replication experiment. (Left) The setup, consisting of a ssDNA bound at one extremity to a small magnetic bead and at the other to the surface of a capillary tube. Small permanent magnets pull on the bead with a force F < 100 pN. F is monitored through the fluctuations δx2 of the bead. The extension l of the molecule is monitored in real time. (Right) The steps during the synthesis of the complementary DNA strand. For small stretching force, the ssDNA has a small extension. Hybridization of a specific primer near one end of the molecule allows the polymerase to start replication. The progression of the polymerase leads to an increase of the molecule's extension. When the entire molecule has been replicated, we increase the stretching force to 50 pN for a short time. This destabilizes the newly synthesized strand, which unpairs from the template and diffuses in the buffer. The ssDNA molecule is ready for a new run of replication.
Figure 2
Figure 2
Force vs. extension curves F(l) for ssDNA. (a) Comparison of the elasticity of a charomid and pXΔII ssDNA in the polymerization buffer and the known dsDNA elasticity curve (WLC, worm-like chain). Length was normalized with respect to the dsDNA extension. (The error in this normalization is ≈10% for the charomid and ≈5% for pXΔII.) Notice that the elastic behavior of these two molecules is different below ≈ 10 pN, consistent with the difference in G+C content of the molecules which influences the stability of secondary structures at low forces. (b) Determination of the extent of polymerization. Extension vs. force curves in polymerization buffer for dsDNA lds(F) (⋄), ssDNA lss(F) before replication (○), partially replicated DNA (□), and ssDNA (+) produced by briefly pulling on the replicated template with a force F > 50 pN to eject the newly synthesized strand. The full line is the superposition lp(F) = plds(F) + (1 − p)lss(F) with percentage replication p = 0.7 which fits the measured points (□) remarkably well.
Figure 3
Figure 3
Time evolution of the replication on a pXΔII ssDNA under a tension of 1 pN (specific priming). (a) Number of bases N(t) replicated by Klenow minus exo3′→5′ as a function of time in two successive replication runs on the same template. Notice that pauses in replication occur at different positions in successive runs. The dots represents the raw data after low-pass filtering at ≈1 Hz. The extension of the DNA is converted into the number of added nucleotides N(t) as explained in the text. The full lines are polygon fits (see Materials and Methods) with an average time duration of 100 s. (b) N(t) for Sequenase in two runs on different molecules. The full lines are polygon fits with an average time duration of 10 s.
Figure 4
Figure 4
Measurement of the replication rate by Sequenase. (a) Time course of replication after high stringency hybridization on pXΔII at 10 pN. The raw data (dots) were fitted by a polygon with M = 40 vertices (shown as ○ in the Inset) as explained in Materials and Methods. (b) Instantaneous replication rate (velocity) as determined from the slope of the polygon segments drawn in a. (c) The histogram of the velocities determined in b displays two peaks. The peak at v = 0 ± 8.6 b/s results from pauses in replication. The broad peak with positive rates results from replication bursts. The boundary between the two peaks is shown by the dashed line at thrice the standard deviation of the pauses peak, i.e., 26 b/s. (d) The instantaneous replication rate histogram at 16 pN (M = 56). The peak of replication bursts has a mean value of ≈50 b/s. The boundary between the pauses and replication peaks is at 20 b/s, lower than in c because of the smaller noise at this higher stretching force.
Figure 5
Figure 5
Force dependence of the replication rate. (a) Replication by Klenow on a charomid is started at 3 pN. Increasing the force to 24 pN stops the replication. After reducing the force back to 3 pN, the polymerization degree, N, has not changed and the enzyme starts replicating again. (b) Number of bases N(t) replicated by Sequenase on pXΔII at two different forces: 1 pN and 16 pN. (c) Mean replication rate, 〈v〉, versus force for Sequenase: high stringency hybridization (K = 13, J = 154; ○) and random priming (K = 5, J = 82; ⋄). The error bars represent σv estimated as explained in Materials and Methods. The full curve is a fit to the model described in the text 〈v(F)〉 = v0exp(−nFΔh/kBT), where v0 = 200 b/s and n = 2.1 (only ○ were fitted). The dashed curve is obtained with the previously determined v0 and n = 1 (as expected if only one base was rate determining). (d) Replication rate versus force for Klenow: low stringency hybridization (K = 24, J = 298; ⋄), high stringency hybridization (K = 9, J = 114; ○). Replication rate for Klenow minus exo3′→5′ high stringency hybridization (K = 4, J = 50; □). The full curve is a fit to ⋄, where v0 = 13.5 b/s and n = 4.

References

    1. Kornberg A, Baker T. DNA Replication. San Francisco: Freeman; 1992.
    1. Kunkel T A, Wilson S H. Nat Struct Biol. 1998;5:95–99. - PubMed
    1. Tabor S, Huber H E, Richardson C C. J Biol Chem. 1987;262:16212–16223. - PubMed
    1. Patel S S, Wong I, Johnson K A. Biochemistry. 1991;30:511–525. - PubMed
    1. Dahlberg M E, Bencovic S J. Biochemistry. 1991;30:4835–4843. - PubMed

Publication types

LinkOut - more resources