. 2000 Oct 24;97(22):12050-5.
doi: 10.1073/pnas.97.22.12050.

Peg3/Pw1 promotes p53-mediated apoptosis by inducing Bax translocation from cytosol to mitochondria

Affiliations

Peg3/Pw1 promotes p53-mediated apoptosis by inducing Bax translocation from cytosol to mitochondria

Y Deng et al. Proc Natl Acad Sci U S A. .

Abstract

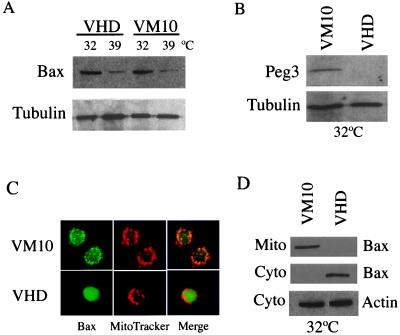
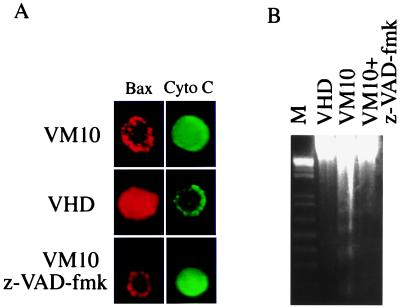
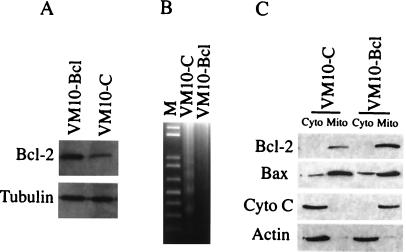
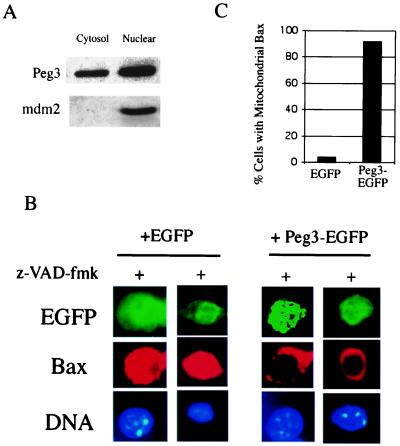
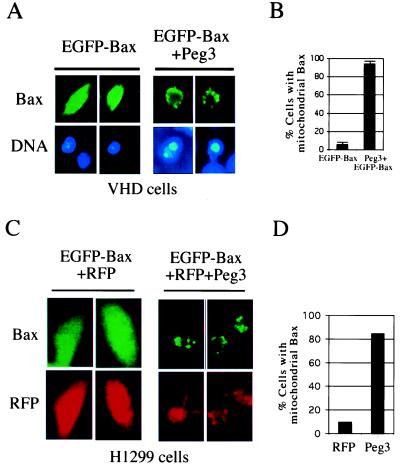
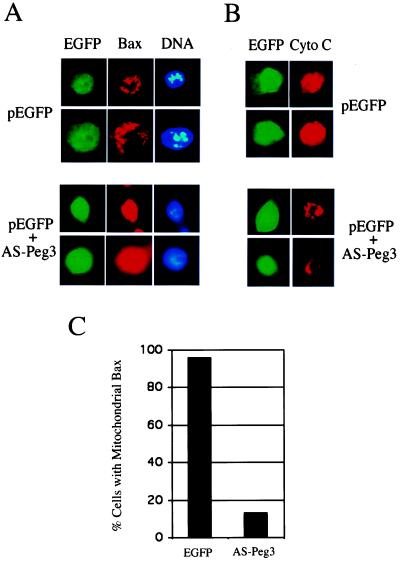
Mitochondria is believed to play a central role in p53-mediated apoptosis. However, the signal transduction pathways leading to mitochondria remain unclear. Here, we report that translocation of Bax protein from cytosol to mitochondria is required for p53-induced apoptosis. Cytosolic Bax is unable to induce apoptosis, and blocking Bax translocation inhibits cell death. Expression of Bcl-2 blocks cytochrome c release and apoptosis but has no effect on Bax translocation, suggesting that Bax translocation acts upstream of Bcl-2. We further demonstrate that Peg3/Pw1, a protein up-regulated in p53-mediated cell death process, induces Bax translocation independent of apoptosis. The results suggest that Bax translocation represents an important regulatory step in p53-mediated apoptosis, and Peg3/Pw1 functions as a modulator downstream of p53 to regulate Bax redistribution in the cells, thus favoring the cellular decision toward apoptosis over growth arrest following p53 induction.


Figures

Figure 1
Figure 1
The VHD and VM10 cells showed similar Bax protein levels but distinct subcellular localization. (A) Expression of Bax protein in VHD and VM10 cells. Whole cell extracts were prepared from VHD and VM10 cells at 32°C (24 h after temperature shift) and 39°C, respectively. The Bax protein was detected by Western Blotting using a monoclonal antibody against Bax. The same blot was stripped and probed with an anti-α-tubulin antibody for loading control. Quantitation was done on a phosphorimager (Molecular Dynamics). (B) Induction of Peg3/Pw1 protein in VM10 cells at 32°C. Protein extracts isolated from VHD and VM10 cells at 32°C were blotted with an anti-Peg3/Pw1 antibody. Peg3/Pw1 is only expressed in VM10 cells at 32°C. (C) Immunostaining of the Bax protein in VHD and VM10 cells at 32°C. The mitochondria were stained with MitoTracker Red CMX Ros (red), and the Bax protein was stained with the monoclonal antibody and visualized with an FITC-conjugated secondary antibody (green). A representation of the staining pattern is shown. (D) Subcellular fractionation of Bax protein in VHD and VM10 cells. Cytosolic and mitochondria extracts were prepared from VHD and VM10 cells at 32°C. The protein concentration was measured using a protein assay kit (Bio-Rad). An equal amount of protein was loaded onto the gel. The Bax protein was detected by Western blots, and cytosolic β-actin was used as a control.
Figure 2
Figure 2
Bax translocation in VM10 cells coincides with cytochrome c release and apoptosis. (A) Immunostaining of Bax and cytochrome c in VM10 and VHD cells at 32°C. The Bax staining was carried out using anti-Bax antibody and a rhodamine-conjugated secondary antibody (red), and cytochrome c was stained with a polyclonal antibody and an FITC-conjugated secondary antibody (green). (B) Inhibition of apoptosis in VM10 cells by z-VAD-fmk. VM10 cells were transferred to 32°C with 100 μM z-VAD-fmk added. The DNA was extracted, and DNA fragmentation was detected by agarose gel electrophoresis.
Figure 3
Figure 3
Expression of Bcl-2 blocks cytochrome c release and apoptosis but does not affect Bax translocation. (A) VM10-bcl cells are generated by stably transfecting a Bcl-2 expressing plasmid, and VM10-C is a cell line transfected by the control vector. The Western blot was probed with a monoclonal antibody against Bcl-2. (B) Bcl-2 blocks apoptosis in VM10 cells. The cells were shifted to 32°C for 24 h, and DNA was analyzed by agarose gel electrophoresis. (C) Bcl-2 expression blocks cytochrome c release but has no effect on Bax translocation. Extracts were prepared from mitochondria and cytosolic fraction of VM10-bcl and VM10-C cells at 32°C. The protein concentration was measured using a protein assay kit (Bio-Rad). An equal amount of protein was loaded onto the gel. Bcl-2, Bax, and cytochrome c proteins were detected by Western blotting. Cytosolic actin was used as a control.
Figure 4
Figure 4
Expression of Peg3/Pw1 induces Bax translocation. (A) Subcellular localization of Peg3/Pw1 in VM10 cells during apoptosis. Cytosolic and nuclear extracts were prepared from VM10 cells at 32°C, and Peg3/Pw1 protein was detected by a Western blot. Western blots for nuclear protein mdm2 were used as the cell fractionation control. (B) The VHD cells at 39°C were transiently transfected with either an EGFP plasmid or a plasmid expressing EGFP-Peg3/Pw1 fusion protein. The cells were shifted to 32°C for 24 h, and caspase inhibitor z-VAD-fmk was added immediately. The transfected cells were marked by GFP fluorescence (green), Bax staining is in red, and DNA was stained by Hochst 3342. Representative staining patterns are chosen from two independent experiments. The Bax staining is diffused (cytosolic) in EGFP-expressing cells and punctuated (mitochondria) in Peg3-EGFP-expressing cells. (C) Percentage of cells with mitochondrial Bax. Different fields of green cells were observed under the fluorescent microscope. A total of 30 cells were counted each time, and the data represent the average of two independent experiments.
Figure 5
Figure 5
Cotransfection of Peg3/Pw1 and Bax resulted in Bax translocation. (A) The VHD cells at 39°C were transiently transfected with either an EGFP-Bax plasmid or EGFP-Bax plus a plasmid expressing Peg3/Pw1 at a molar ration of 1 to 3. The Bax staining was visualized by GFP fluorescence (green), and DNA was stained by Hochst 3342. Representative staining patterns are chosen from two independent experiments. The Bax staining is diffused (cytosolic) in EGFP-expressing cells and punctuated (mitochondria) in Peg3-expressing cells. (B) Percentage of cells with mitochondrial Bax. Different fields of green cells were observed under the fluorescent microscope. A total of 30 cells were counted each time, and the data represent the average of three independent experiments. Standard deviations were given. (C) The H1299 cells were transiently transfected with either an EGFP-Bax and RFP DNA or EGFP-Bax and RFP plus a plasmid expressing Peg3/Pw1. The Bax staining was visualized by GFP fluorescence (green), and transfected cells were marked by RFP fluorescence (red). Representative staining patterns are chosen from two independent experiments. (D) Percentage of cells with mitochondrial Bax. Different fields of green cells were observed under the fluorescent microscope. A total of 50 cells were counted each time, and the data represent the average of two independent experiments.
Figure 6
Figure 6
Antisense Peg3/Pw1 blocks Bax translocation, cytochrome c release, and apoptosis in VM10 cells. (A) VM10 cells were transfected with either EGFP or EGFP plus a plasmid expressing antisense Peg3/Pw1 mRNA at a molar ration of 1 to 3. The cells were stained for Bax protein and DNA as described in Fig. 4. The Bax staining is punctuated (mitochondria) in EGFP-expressing cells and diffused (cytosolic) in AS-Peg3-expressing cells. (B) Duplicate of the same transfected cells were stained with anti-cytochrome c antibody. Representative staining patterns are chosen from two independent experiments. A revised staining pattern compared to Bax was observed for cytochrome c. (C) Percentage of cells with mitochondrial Bax. Different fields of green cells were observed under the fluorescent microscope. A total of 30 cells were counted each time, and the data represent the average of two independent experiments.

References

    1. Hollstein M, Sidransky D, Vogelstein B, Harris C C. Science. 1991;253:49–53. - PubMed
    1. Greenblatt M S, Bennett W P, Hollstein M, Harris C C. Cancer Res. 1994;54:4855–4878. - PubMed
    1. Hainaut P, Hernandez T, Robinson A, Rodriguez-Tome P, Flores T, Hollstein M, Harris C C, Montesano R. Nucleic Acids Res. 1998;26:205–213. - PMC - PubMed
    1. Levine A J. Cell. 1997;88:323–331. - PubMed
    1. May P, May E. Oncogene. 1999;18:7621–7636. - PubMed

Publication types

MeSH terms