. 2000 Oct 24;97(22):12216-21.
doi: 10.1073/pnas.97.22.12216.

PCGEM1, a prostate-specific gene, is overexpressed in prostate cancer

Affiliations

PCGEM1, a prostate-specific gene, is overexpressed in prostate cancer

V Srikantan et al. Proc Natl Acad Sci U S A. .

Abstract

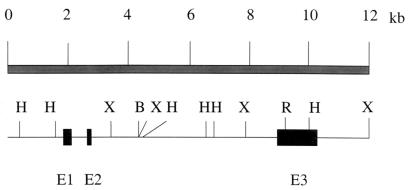
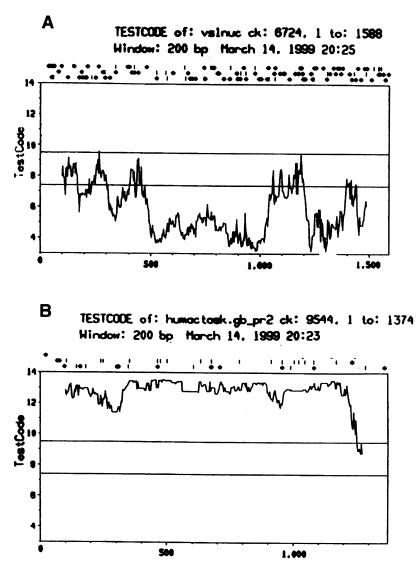
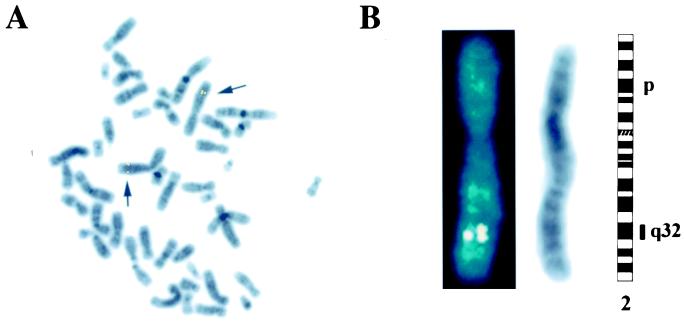
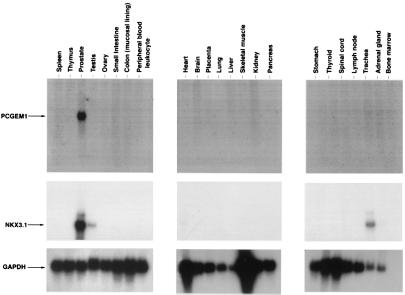
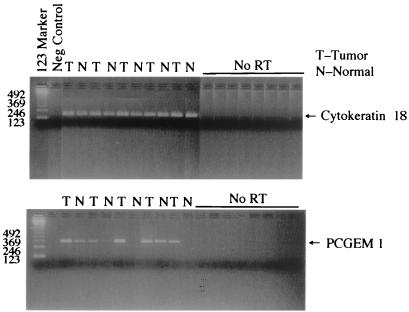
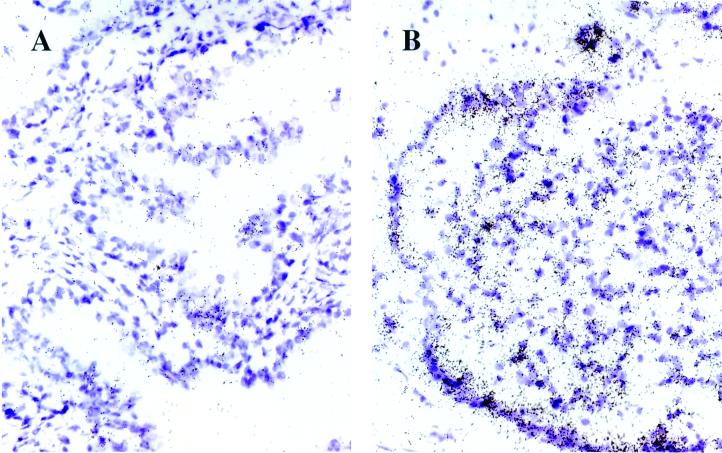
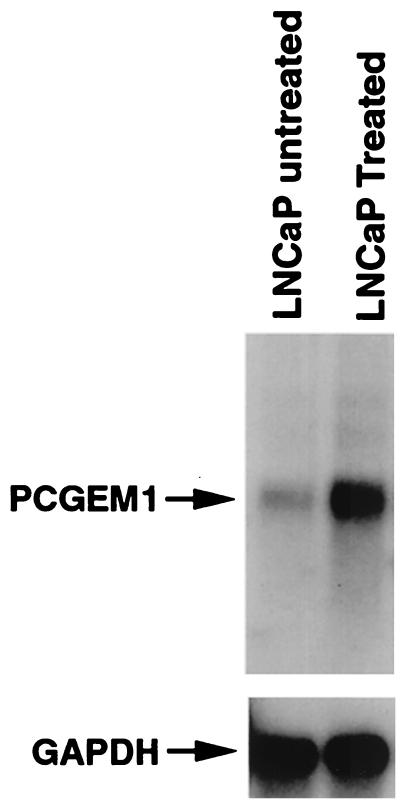
A prostate-specific gene, PCGEM1, was identified by differential display analysis of paired normal and prostate cancer tissues. Multiple tissue Northern blot analysis revealed that PCGEM1 was expressed exclusively in human prostate tissue. Analysis of PCGEM1 expression in matched normal and primary tumor specimens revealed tumor-associated overexpression in 84% of patients with prostate cancer by in situ hybridization assay and in 56% of patients by reverse transcription-PCR assay. Among various prostate cancer cell lines analyzed, PCGEM1 expression was detected only in the androgen receptor-positive cell line LNCaP. Extensive DNA sequence analysis of the PCGEM1 cDNA and genomic DNA revealed that PCGEM1 lacks protein-coding capacity and suggests that it may belong to an emerging class of noncoding RNAs, also called "riboregulators." The PCGEM1 locus was mapped to chromosome 2q32. Taken together, the remarkable prostate-tissue specificity and androgen-dependent expression of PCGEM1 as well as its elevated expression in a significant percentage of tumor tissues suggest specific functions of PCGEM1 in the biology and tumorigenesis of the prostate gland.


Figures

Figure 1
Figure 1
Structure of the PCGEM1 transcription unit. Sequence comparison of the isolated cDNA and genomic DNA clones revealed that the PCGEM1 gene consists of three exons. kb, kilobase; E, exon; B, BamHI; H, HindIII; X, XbaI; R, EcoRI.
Figure 2
Figure 2
Evaluation of the coding capacity of PCGEM1. Evaluation of the coding capacity of the PCGEM1 (A) and the human alpha actin (B), independently from the reading frame, by using the TESTCODE program (GCG). The number of base pairs is indicated on the x axis, the TESTCODE values are shown on the y axis. Regions of longer than 200 base pairs above the upper line (at 9.5 value) are considered coding; those under the lower line (at 7.3 value) are considered noncoding at a confidence level greater than 95%.
Figure 3
Figure 3
Chromosomal localization of PCGEM1. PCGEM1 was mapped by fluorescence in situ hybridization to 2q32 by using a bacterial artificial chromosome clone. (A) A representative metaphase showing doublet signal on both homologs of chromosome 2 (arrows). (B) A 4′,6-diamidino-2-phenylindole-counterstained chromosome 2 showing the signal (Left). An inverted 4′,6-diamidino-2-phenylindole-stained chromosome 2 shown as G bands (Center). An ideogram of chromosome 2 showing the localization of the signal to band 2q32 (Right).
Figure 4
Figure 4
Tissue-specific expression of PCGEM1. Multiple tissue Northern blots (CLONTECH) were hybridized with PCGEM1, NKX3.1, and GAPDH cDNA probe. Blots were exposed to x-ray films for different times: PCGEM1 for 48 h, NKX3.1 for 24 h, and GAPDH for 15 min.
Figure 5
Figure 5
Evaluation of PCGEM1 expression in primary CaP. Genomic DNA-free RNA (100-ng) samples from microdissected tissues were used to analyze expression of PCGEM1 and cytokeratin-18 by RT-PCR. Three independent experiments showed the same results.
Figure 6
Figure 6
PCGEM1 expression in normal and tumor areas of CaP tissues. In situ hybridization of 35S-labeled PCGEM1 riboprobe to matched normal (A) versus tumor (B) sections of patients with CaP. The purple areas are hematoxylin-stained cell bodies; the black dots represent the PCGEM1 expression signal. The signal is background level in the normal (A) and 2+ level in the tumor (B) section. The magnification is ×40.
Figure 7
Figure 7
Androgen regulation of PCGEM1. LNCaP cells were cultured in RPMI medium 1640 containing 10% (vol/vol) charcoal-stripped FBS for 4 days and were followed by treatment with synthetic androgen (R1881 for 24 h at 10 nanomolar concentrations). Poly(A)+ RNA from treated and untreated cells was analyzed for PCGEM1 expression by Northern blot hybridization as described for Fig. 4.

References

    1. Landis S H, Murray T, Bolden S, Wingo P A. Ca Cancer J Clin. 1999;49:8–31. - PubMed
    1. Garnick M B, Fair W R. Sci Am. 1998;279(6):74–83. - PubMed
    1. Augustus M, Moul J W, Srivastava S. In: Molecular Pathology of Early Cancer. Srivastava S, Henson D E, Gazden A, editors. Amsterdam: IOS; 1999. pp. 321–340.
    1. Fair W R, Israeli R S, Heston W D. Prostate. 1997;32:140–148. - PubMed
    1. Murphy G P, Tjoa B A, Simmons S J, Jarisch J, Bowes V A, Ragde H, Rogers M, Elgamal A, Kenny G M, et al. Prostate. 1999;38:73–78. - PubMed

Publication types

MeSH terms

Associated data