. 2000 Nov;2(11):812-8.
doi: 10.1038/35041055.

Functional dissection of in vivo interchromosome association in Saccharomyces cerevisiae

Affiliations

Functional dissection of in vivo interchromosome association in Saccharomyces cerevisiae

L Aragón-Alcaide et al. Nat Cell Biol. 2000 Nov.

Abstract

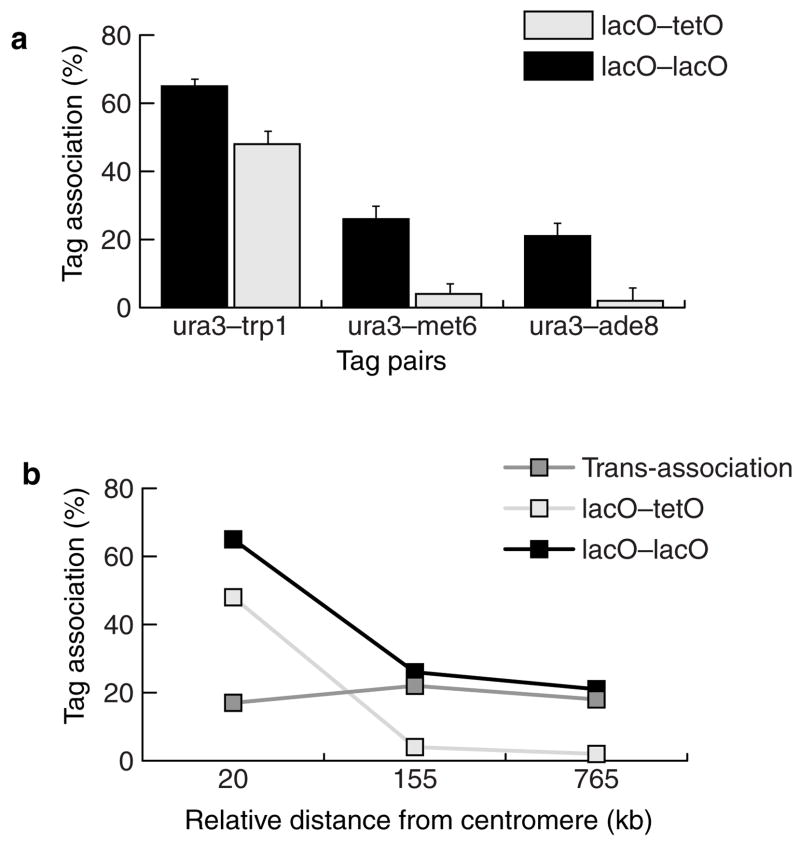
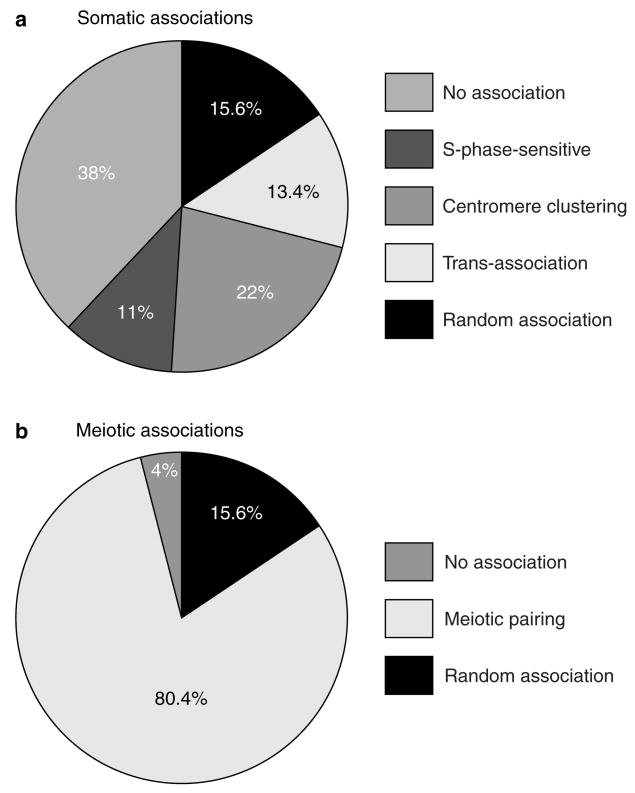
Homologue pairing mediates both recombination and segregation of chromosomes at meiosis I. The recognition of nucleic-acid-sequence homology within the somatic nucleus has an impact on DNA repair and epigenetic control of gene expression. Here we investigate interchromosomal interactions using a non-invasive technique that allows tagging and visualization of DNA sequences in vegetative and meiotic live yeast cells. In non-meiotic cells, chromosomes are ordered in the nucleus, but preferential pairing between homologues is not observed. Association of tagged chromosomal domains occurs irrespective of their genomic location, with some preference for similar chromosomal positions. Here we describe a new phenomenon that promotes associations between sequence-identical ectopic tags with a tandem-repeat structure. These associations, termed interchromosome trans-associations, may underlie epigenetic phenomena.


Figures

Figure 1
Figure 1. Interchromosome-association assay and tag positions
a, Schematic diagram of the assay. lacO arrays were introduced in different genomic positions and the associations between these loci were recorded. Association of lacO repeats is visible as a single fluorescent dot. b, Positions of the tagged loci: two centromere-linked sites (ura3 and trp1) and two distal sites (met6 and ade8). Chromosome numbers are shown at the top.
Figure 2
Figure 2. Time course of sporulation
a, Synchronous meiotic time course (0–16 h after induction), as analysed by DAPI staining. The timing of meiosis I & II was calculated from the percentage of cells with one, two or four nuclei at the indicated times. b, Phase-contrast (left panels) and fluorescent (right panels) images of sporulating and vegetative LA120 cells with integrated pDMC1:ECFP–NES. Sporulating cells express ECFP–NES (blue), whereas vegetatively growing cells show no ECFP–NES expression.
Figure 3
Figure 3. In vivo chromosome association in meiosis
a–d, Meiotic cells 6 h after transfer to sporulation media (SPM), carrying green fluorescent protein (GFP) tags at the trp1 loci in both homologues. a, Phase-contrast image; b, GFP chromosome tags shown in green; c, ECFP–NES expressed under control of the DMC1 promoter; arrows show the location of the nucleus; d, Colour overlay of b and c, showing GFP in green and ECFP in blue. e, f, Tetrads from a strain with both homologues tagged at the trp1 locus (e) or at one trp1 and one ura3 locus (f). Arrows indicate the segregation of GFP tags (green). g, Synchronous meiotic time-course analysis of interchromosome interactions 0–10 h after transfer to SPM. Trans-association between lacOlacO (black bars, allelic; open bars, non-allelic) and lacOtetO (grey bars) tags located at centromere-proximal sites (ura3 and trp1). Error bars represent s.d. Homologue pairing is detected at 4–6 h, at which time a reduction in non-allelic and an increase of allelic pairing is observed.
Figure 4
Figure 4. In vivo association of GFP chromosome tags during the mitotic cycle
a–f, Examples of yeast somatic cells at different stages of cell cycle, carrying lacO and tetO green fluorescent protein (GFP) tags. Images are colour overlays, showing GFP in green and phase contrast in cyan. a, Exponentially growing cells, with two trp1(lacO) GFP tags. b, Elutriated G1 cells, with two trp1(lacO) GFP tags. c, Cells sequentially treated with hydroxyurea and nocodazole, with trp1(lacO) and ura3(lacO) GFP tags. d, Elutriated S-phase cells, with ura3(lacO) and trp1(lacO) GFP tags. e, Elutriated G1 cells, with ura3(lacO) and met6(lacO) GFP tags. f, Cells sequentially treated with hydroxyurea and nocodazole, with trp1(lacO) and ura3(tetO) GFP tags. Numbers with arrows indicate how signals were scored: 1, associated; 2, separated. g, Interchromosome associations in somatic cells. Exponentially growing (Asyn) and synchronous (G1, S and G2/M) cultures were evaluated. Culture synchrony was achieved by elutriation (G1), or by elutriation followed by treatment with hydroxyurea (S), or nocodazole (G2/M). Allelic (black bars), non-allelic (open bars) and non-homologous lacOtetO (grey bars, control) interactions are shown.
Figure 5
Figure 5. Trans-association of chromosomal tags
a, Trans-association between lacOlacO (black bars) and lacOtetO (open bars) tags located at different centromere-to-locus distances. The tagged loci are ura3 (35 kb from CEN), trp1 (15 kb), met6 (190 kb) and ade8 (800 kb). lacOtetO associations were used as a control to identify the subset of lacOlacO associations that is due to sequence identity. b, Association between lacOlacO (black points) repeats, lacOtetO (open points) and trans-association (grey points), plotted as a function of relative centromere distance (subtraction of centromeric distances of two loci in each pair). Trans-association values were obtained by subtracting lacOtetO associations from lacOlacO.
Figure 6
Figure 6. Dissection of somatic interchromosomal trans-association and meiotic homologue pairing
a, Factors that contribute to somatic interchromosomal associations averaged for lacOlacO interactions at allelic (trp1trp1), and non-allelic centromere-linked (trp1ura3) sites. Percentages were calculated as follows: random association, average lacOtetO stochastic-collision values from ura3trp1, ura3met6 and ura3ade8 associations (Fig. 5a); S-phase sensitive, subtraction of S values from G2/M values (Fig. 4g); centromere clustering, subtraction of G2/M values from G1 values (Fig. 4g); trans-association, average values obtained by subtracting lacOtetO values from lacOlacO values (Fig. 4g); no association, subtraction of G1 values from 100% (Fig. 4g). Some of the categories may overlap to some degree; for instance, both centromere clustering and trans-association may have an S-phase-sensitive component. b, Comparison of homologue and non-homologue interactions for meiotic cells. Percentages were calculated as follows: random, same values assumed as for a; no association, subtraction of lacOlacO allelic pairing at t = 6 h from 100% (Fig. 3g); meiotic pairing, subtraction of random values from values for lacOlacO allelic sites at t = 6 h (Fig. 3g).

References

    1. Csink AK, Henikoff S. Genetic modification of heterochromatic association and nuclear organization in Drosophila. Nature. 1996;381:529–531. - PubMed
    1. Dorer DR, Henikoff S. Transgene repeat arrays interact with distant heterochromatin and cause silencing in cis and trans. Genetics. 1997;147:1181–1190. - PMC - PubMed
    1. Lichten M, Haber JE. Position effects in ectopic and allelic mitotic recombination in Saccharomyces cerevisiae. Genetics. 1989;123:261–268. - PMC - PubMed
    1. Kassis JA, VanSickle EP, Sensabaugh SM. A fragment of engrailed regulatory DNA can mediate transvection of the white gene in Drosophila. Genetics. 1991;128:751–761. - PMC - PubMed
    1. Haber JE, et al. Physical monitoring of meiotic and mitotic recombination in yeast. Prog Nucleic Acids Res Mol Biol. 1988;35:209–259. - PubMed

Publication types

MeSH terms

LinkOut - more resources