Enhanced expression of genes involved in coagulation and fibrinolysis in murine arthritis
- PMID: 11056680
- PMCID: PMC17822
- DOI: 10.1186/ar132
Enhanced expression of genes involved in coagulation and fibrinolysis in murine arthritis
Abstract
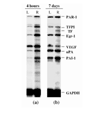
STATEMENT OF FINDINGS: We have analyzed the pattern of procoagulant and fibrinolytic gene expression in affected joints during the course of arthritis in two murine models. In both models, we found an increased expression of tissue factor, tissue factor pathway inhibitor, urokinase plasminogen activator, and plasminogen activator inhibitor 1, as well as thrombin receptor. The observed pattern of gene expression tended to favor procoagulant activity, and this pattern was confirmed by functional assays. These alterations would account for persistence of fibrin within the inflamed joint, as is seen in rheumatoid arthritis.
Figures


Similar articles
-
Elastase- and plasmin-mediated fibrinolysis in rheumatoid arthritis.Int J Tissue React. 1994;16(2):89-93. Int J Tissue React. 1994. PMID: 7960505 Clinical Trial.
-
Studies of thrombin-induced proteoglycan release in the degradation of human and bovine cartilage.J Clin Invest. 1994 Aug;94(2):472-80. doi: 10.1172/JCI117358. J Clin Invest. 1994. PMID: 8040300 Free PMC article.
-
Increased production of intracellular interleukin-1 receptor antagonist type I in the synovium of mice with collagen-induced arthritis: a possible role in the resolution of arthritis.Arthritis Rheum. 2001 Feb;44(2):451-62. doi: 10.1002/1529-0131(200102)44:2<451::AID-ANR64>3.0.CO;2-H. Arthritis Rheum. 2001. PMID: 11229477
-
Renal expression of fibrinolytic genes and tissue factor in a murine model of renal disease as a function of age.Semin Thromb Hemost. 1998;24(3):261-8. doi: 10.1055/s-2007-995852. Semin Thromb Hemost. 1998. PMID: 9701458 Review.
-
Coagulation, fibrinolysis, and fibrin deposition in acute lung injury.Crit Care Med. 2003 Apr;31(4 Suppl):S213-20. doi: 10.1097/01.CCM.0000057846.21303.AB. Crit Care Med. 2003. PMID: 12682443 Review.
Cited by
-
Amelioration of collagen-induced arthritis by thrombin inhibition.J Clin Invest. 2001 Mar;107(5):631-40. doi: 10.1172/JCI11064. J Clin Invest. 2001. PMID: 11238564 Free PMC article.
-
Autoimmunity against fibrinogen mediates inflammatory arthritis in mice.J Immunol. 2010 Jan 1;184(1):379-90. doi: 10.4049/jimmunol.0901639. Epub 2009 Nov 30. J Immunol. 2010. PMID: 19949094 Free PMC article.
-
The Urokinase Plasminogen Activation System in Rheumatoid Arthritis: Pathophysiological Roles and Prospective Therapeutic Targets.Curr Drug Targets. 2019;20(9):970-981. doi: 10.2174/1389450120666181204164140. Curr Drug Targets. 2019. PMID: 30516104 Free PMC article. Review.
-
Changes in concentrations of haemostatic and inflammatory biomarkers in synovial fluid after intra-articular injection of lipopolysaccharide in horses.BMC Vet Res. 2017 Jun 19;13(1):182. doi: 10.1186/s12917-017-1089-1. BMC Vet Res. 2017. PMID: 28629364 Free PMC article.
-
mRNA expression of genes involved in inflammation and haemostasis in equine fibroblast-like synoviocytes following exposure to lipopolysaccharide, fibrinogen and thrombin.BMC Vet Res. 2015 Jun 27;11:141. doi: 10.1186/s12917-015-0448-z. BMC Vet Res. 2015. PMID: 26116380 Free PMC article.
References
-
- Firestein GS. Etiology and pathogenesis of rheumatoid arthritis. . In Textbook of Rheumatology Edited by Kelley WN, Harris ED, Ruddy S, Sledge CB Philadelphia: W B Saunders, 1997. pp. 851–897.
-
- Clemmensen I, Holund B, Andersen RB. Fibrin and fibronectin in rheumatoid synovial membrane and rheumatoid synovial fluid. Arthritis Rheum. 1983;26:479–485. - PubMed
-
- Weinberg JB, Pippen AM, Greenberg CS. Extravascular fibrin formation and dissolution in synovial tissue of patients with osteoarthritis and rheumatoid arthritis. Arthritis Rheum. 1991;34:996–1005. - PubMed
-
- Carmassi F, De Negri F, Morale M, Puccetti R, Chung SI. Elastase- and plasmin-mediated fibrinolysis in rheumatoid arthritis. . Int J Tissue React. 1994;16:89–93. - PubMed
Publication types
MeSH terms
Substances
LinkOut - more resources
Full Text Sources
Medical
Research Materials

