

Role of bedside electroencephalography in the adult intensive care unit during therapeutic neuromuscular blockade
- PMID: 11056693
- PMCID: PMC28985
- DOI: 10.1186/cc3
Role of bedside electroencephalography in the adult intensive care unit during therapeutic neuromuscular blockade
Abstract
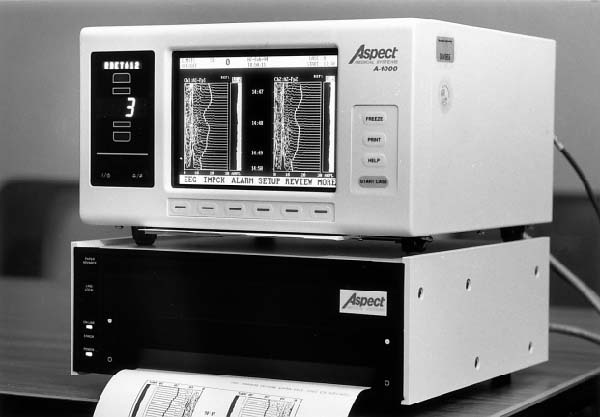
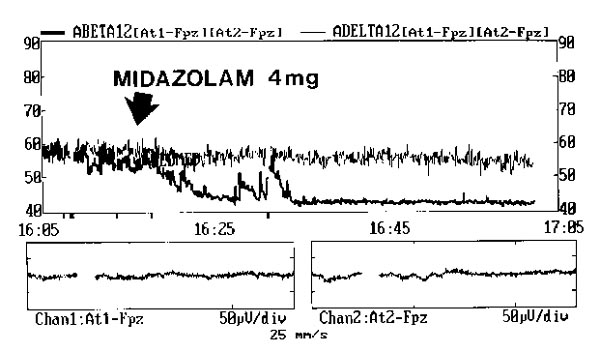
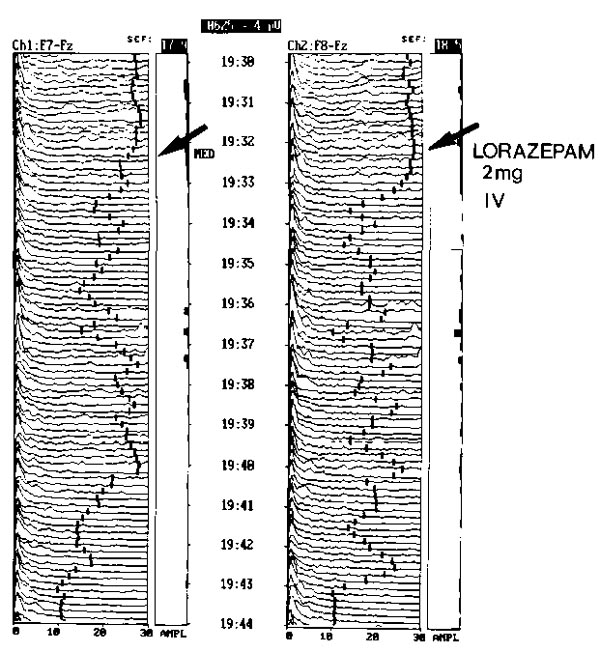
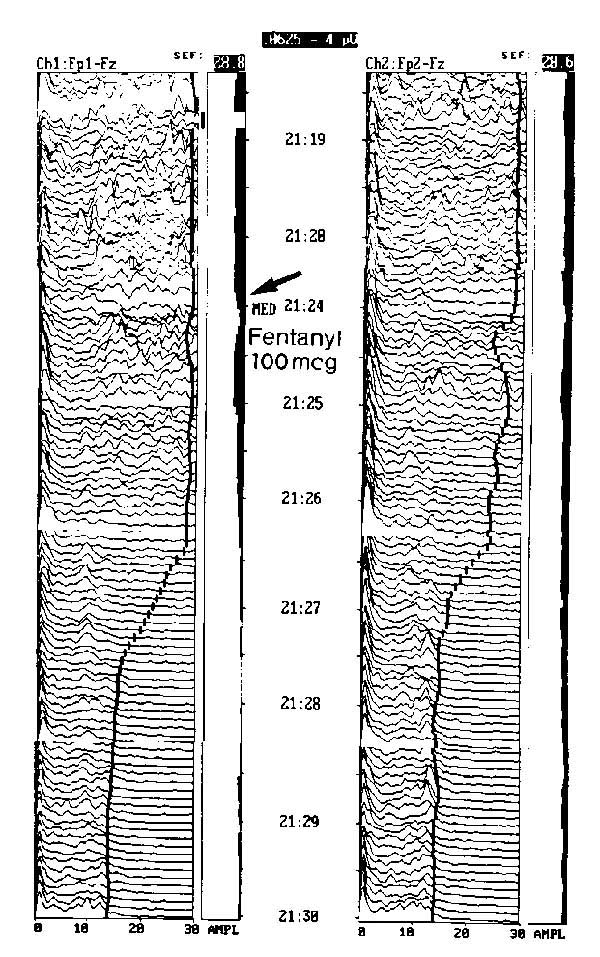
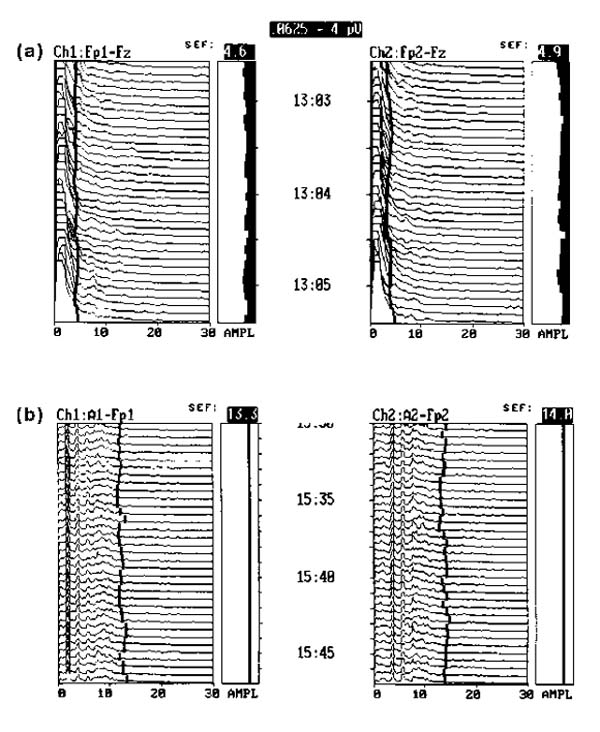
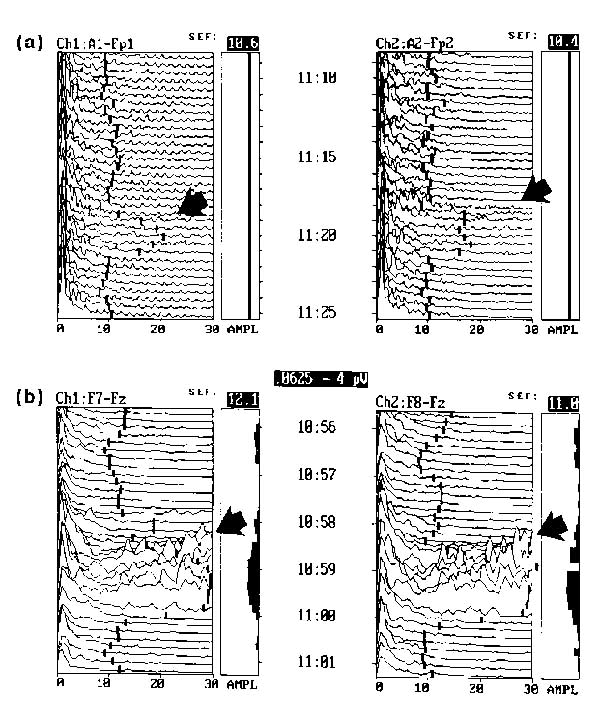
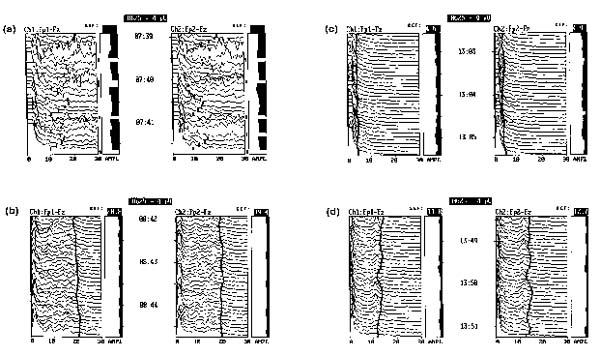
BACKGROUND: Size, weight and technical difficulties limit the use of ponderous strip chart electroencephalographs (EEGs) for real time evaluation of brain wave function in modern intensive care units (ICUs). Portable, computer processed, bedside EEGs provide real time brain wave appraisal for some brain functions during therapeutic neuromuscular blockade when the visual clues of the cerebral function disappear. RESULTS: Critically ill ICU patients are frequently placed in suspended animation by neuromuscular blockade to improve hemodynamics in severe organ system failure. Using the portable bedside EEG monitor, several cerebral functions were monitored continuously during sedation of selected patients in our ICU. CONCLUSIONS: The processed EEG is able to continuously monitor the end result of some therapeutics at the neuronal level when natural artifacts are suppressed or eliminated by neuromuscular blockade. Computer processed EEG monitoring may be the only objective method of assessing and controlling sedation during therapeutic musculoskeletal paralysis.
Figures
Similar articles
-
Neurologic monitoring in the intensive care unit.New Horiz. 1994 Feb;2(1):107-20. New Horiz. 1994. PMID: 7922425 Review.
-
Assessment of sedation, analgesia, and neuromuscular blockade in the perioperative period.Int Anesthesiol Clin. 1996 Summer;34(3):215-41. Int Anesthesiol Clin. 1996. PMID: 8894756 Review.
-
A novel approach for computer assisted EEG monitoring in the adult ICU.Clin Neurophysiol. 2011 Oct;122(10):2100-9. doi: 10.1016/j.clinph.2011.02.035. Epub 2011 Apr 6. Clin Neurophysiol. 2011. PMID: 21474372
-
Technical and interpretive problems of peripheral nerve stimulation in monitoring neuromuscular blockade in the intensive care unit.Ann Pharmacother. 1996 Feb;30(2):165-72. doi: 10.1177/106002809603000211. Ann Pharmacother. 1996. PMID: 8835051 Review.
-
Use of peripheral nerve stimulators to monitor patients with neuromuscular blockade in the ICU.Am J Crit Care. 1996 Nov;5(6):449-54. Am J Crit Care. 1996. PMID: 8922161
Cited by
-
Therapeutic hypothermia after cardiac arrest: outcome predictors.Rev Bras Ter Intensiva. 2015 Oct-Dec;27(4):322-32. doi: 10.5935/0103-507X.20150056. Rev Bras Ter Intensiva. 2015. PMID: 26761469 Free PMC article.
-
Evaluation of Objective Sedation Monitoring Practices in Critically Ill Adult Patients: A Systematic Review and Meta-Analysis.Crit Care Explor. 2025 Aug 11;7(8):e1297. doi: 10.1097/CCE.0000000000001297. eCollection 2025 Aug 1. Crit Care Explor. 2025. PMID: 40788313 Free PMC article.
-
Sedation for critically ill or injured adults in the intensive care unit: a shifting paradigm.Drugs. 2012 Oct 1;72(14):1881-916. doi: 10.2165/11636220-000000000-00000. Drugs. 2012. PMID: 22950534 Review.
-
Changes in SedLine-derived processed electroencephalographic parameters during hypothermia in patients undergoing cardiac surgery with cardiopulmonary bypass.Front Cardiovasc Med. 2023 Jul 4;10:1084426. doi: 10.3389/fcvm.2023.1084426. eCollection 2023. Front Cardiovasc Med. 2023. PMID: 37469479 Free PMC article.
-
The Benefit of Neuromuscular Blockade in Patients with Postanoxic Myoclonus Otherwise Obscuring Continuous Electroencephalography (CEEG).Crit Care Res Pract. 2017;2017:2504058. doi: 10.1155/2017/2504058. Epub 2017 Feb 6. Crit Care Res Pract. 2017. PMID: 28265468 Free PMC article.
References
-
- Crippen DW. Neurologic monitoring in the intensive care unit. New Horizons. 1994;2:107–120. - PubMed
-
- Lopes da Silva F. EEG analysis: theory and practice. In Electroencephalography: Basic Principles, Clinical Applications and Related Fields Edited by Neidermyer E, Lopes da Silva F Baltimore/Munich: Urban & Schwartzenberg, 1982. pp. 685–711.
-
- Myers RR, Stockard JJ, Saidman LJ. Monitoring of cerebral perfusion during anesthesia by time compressed Fourier analysis of the electroencephalogram. . Stroke. 1977;8:331–337. - PubMed
-
- Speher W, Stemmler G. Post alcoholic diseases: diagnostic relevance of computerized EEG. . Electroencephalogr Clin Neurophysiol. 1985;60:106–114. - PubMed
-
- Pichlmayer I, Lehmkuhl P, Lips U. EEG Atlas for Anesthesiologists Berlin: Springer-Verlag, 1987. pp. 10–18.
LinkOut - more resources
Full Text Sources
