. 2000 Nov 1;28(21):4283-90.
doi: 10.1093/nar/28.21.4283.

Blocking transcription of the human rhodopsin gene by triplex-mediated DNA photocrosslinking

Affiliations

Blocking transcription of the human rhodopsin gene by triplex-mediated DNA photocrosslinking

Z Intody et al. Nucleic Acids Res. .

Abstract

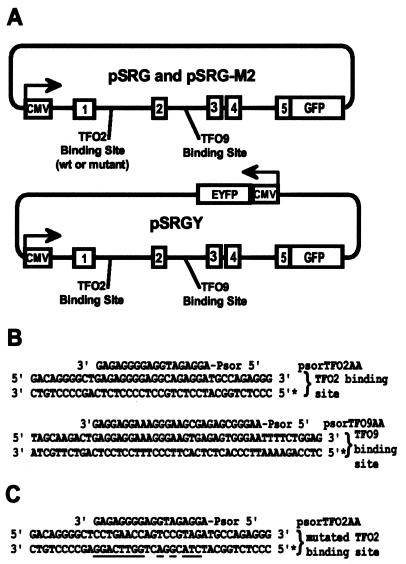
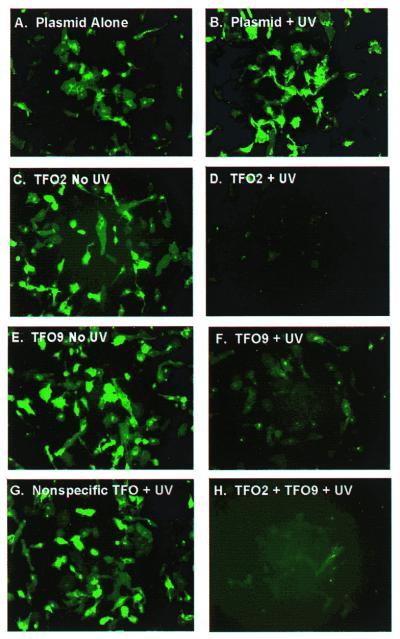
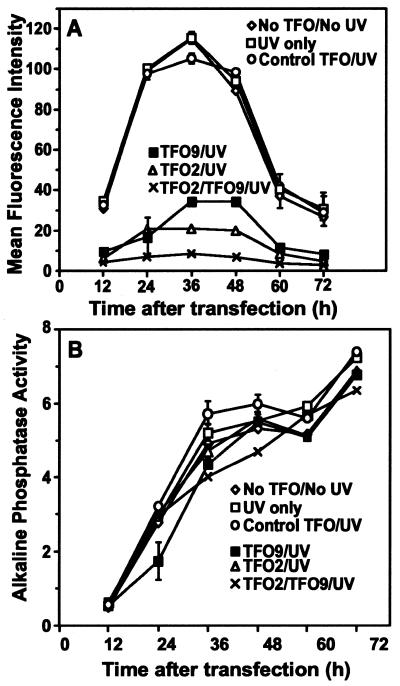
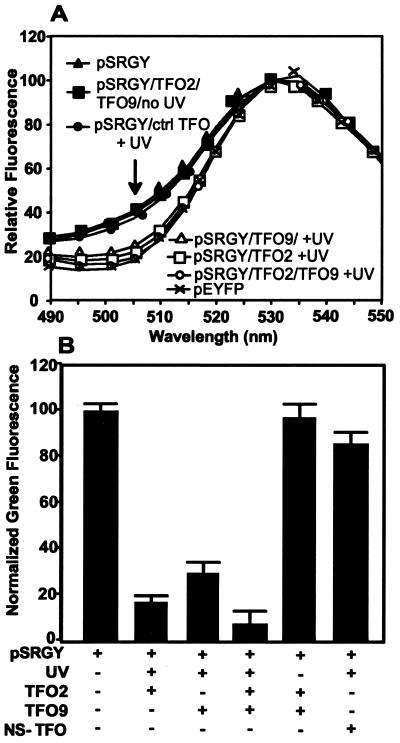
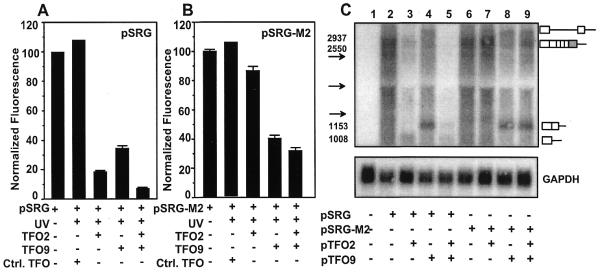
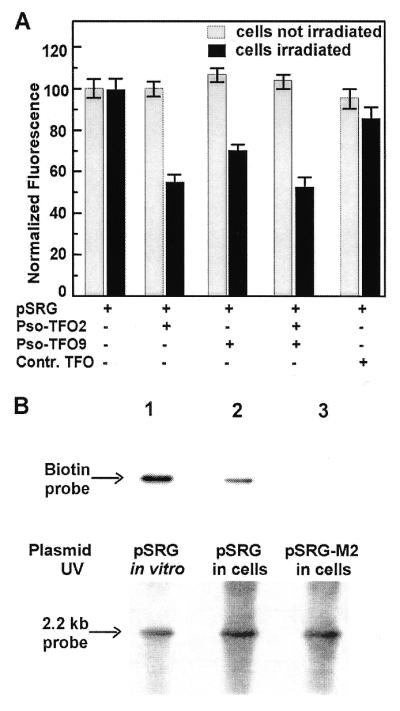
To explore the ability of triplex-forming oligodeoxyribonucleotides (TFOs) to inhibit genes responsible for dominant genetic disorders, we used two TFOs to block expression of the human rhodopsin gene, which encodes a G protein-coupled receptor involved in the blinding disorder autosomal dominant retinitis pigmentosa. Psoralen-modified TFOs and UVA irradiation were used to form photoadducts at two target sites in a plasmid expressing a rhodopsin-EGFP fusion, which was then transfected into HT1080 cells. Each TFO reduced rhodopsin-GFP expression by 70-80%, whereas treatment with both reduced expression by 90%. Expression levels of control genes on either the same plasmid or one co-transfected were not affected by the treatment. Mutations at one TFO target eliminated its effect on transcription, without diminishing inhibition by the other TFO. Northern blots indicated that TFO-directed psoralen photoadducts blocked progression of RNA polymerase, resulting in truncated transcripts. Inhibition of gene expression was not relieved over a 72 h period, suggesting that TFO-induced psoralen lesions are not repaired on this time scale. Irradiation of cells after transfection with plasmid and psoralen-TFOs produced photoadducts inside the cells and also inhibited expression of rhodopsin-EGFP. We conclude that directing DNA damage with psoralen-TFOs is an efficient and specific means for blocking transcription from the human rhodopsin gene.


Figures

Figure 1
Figure 1
Plasmids and TFOs used in this study. (A) A genomic copy of the rhodopsin gene is fused to GFP cDNA and driven by the CMV promoter. Exons are shown as numbered boxes while introns and plasmid sequences are shown as lines. Exons and introns within the rhodopsin gene are drawn roughly to scale; other regions are not. The locations of the TFO2 and TFO9 binding sites are shown. (B) Psoralen–TFOs are aligned with their cognate binding sites and flanking regions. The mRNA identical strand in each binding site is marked with an asterisk at the 5′-end. (C) The sequence of the mutated TFO2 binding site in pSRG-M2 is shown with psoralen–TFO2. Nucleotide changes are underlined. The mRNA identical strand is marked with an asterisk at the 5′-end.
Figure 2
Figure 2
Fluorescence microscopy of HT1080 cells transfected with pSRG treated as indicated: (A) no treatment; (B) UVA alone; (C) psoralen–TFO2, no UVA; (D) psoralen–TFO2 and UVA; (E) psoralen–TFO9, no UVA; (F) psoralen–TFO9 and UVA; (G) control psoralen–TFO and UVA; (H) psoralen–TFO2, psoralen–TFO9 and UVA. Images were acquired 18 h post-transfection using EGFP optics.
Figure 3
Figure 3
Rhodopsin–GFP fluorescence and alkaline phosphatase activity over time. (A) The mean fluorescence intensity of cells transfected with various plasmid samples was determined by FACS analysis and plotted (arbitrary units) as a function of time after transfection. (B) Alkaline phosphatase activity was determined from an aliquot of the cell medium from each sample. Activity, monitored by the fluorescence intensity of the dephosphorylated substrate and described by an arbitrary number, is plotted as a function of time after transfection. Data points represent the average of two parallel experiments with the range of values indicated by error bars, where they exceed the size of the symbol.
Figure 4
Figure 4
Expression of pEYFP (yellow) and pSRGY (green and yellow). (A) Emission spectra of cells transfected with pSRGY treated as indicated or with untreated pEYFP, normalized to emission at 530 nm. (B) Normalized green fluorescence at 505 nm, calculated from the emission spectra as described in the text.
Figure 5
Figure 5
Loss of TFO2 effects by mutation of its target site. (A) Fluorescence was analyzed as in Figure 3 after pSRG was treated with psoralen–TFOs and UVA irradiation and transfected into HT1080 cells. (B) As (A) except that plasmid pSRG-M2, containing the TFO2 target site mutation, was used. The mean fluorescence intensity of pSRG-M2 was within 5% of the mean fluorescence intensity of pSRG. (C) Northern blot analysis of rhodopsin–GFP mRNA levels was performed on ∼20 µg total RNA using a rhodopsin-specific probe. Predicted sizes of various transcripts are indicated by numbers. The arrows represent the migration positions of the 2.37 (top arrow) and 1.35 kb (bottom arrow) molecular weight markers and the 18S rRNA (1.9 kb, middle arrow). Exons are represented by boxes and introns represented by lines. The shaded box represents the coding region of EGFP.
Figure 6
Figure 6
Formation of TFO-targeted crosslinks within living cells. (A) FACS results from control cells and cells treated with pSRG and psoralen–TFO2 and/or psoralen–TFO9 prior to UVA irradiation of the washed cells. Grey bars represent samples that did not receive any UVA irradiation after transfection, whereas black bars show samples that were irradiated 1 h after transfection. Three independent experiments were carried out and the results plotted are the means, normalized to the control (transfection with plasmid but no TFO), for each condition, with error bars indicating the standard error. (B) Southern blot of plasmid DNA extracted from cells after treatment with pSRG or pSRG-M2 and psoralen–TFO2–biotin prior to UVA irradiation of the washed cells (lanes 2 and 3) and from cells transfected with the TFO already crosslinked to pSRG (lane 1). (Top) The result of probing with alkaline phosphatase-conjugated streptavidin followed by recording of chemiluminescence for detection of the biotin tag. (Bottom) The result of probing with a 32P-labeled probe specific for the plasmid fragment containing the triplex site, as a control for equal loading and transfer, and to verify that the photoadduct corresponds to the intended fragment. Arrows show the migration position corresponding to 2.2 kb.

Similar articles

Cited by

References

    1. Vasquez K.M. and Wilson,J.H. (1998) Trends Biochem. Sci., 23, 4–9. - PubMed
    1. Ing N.H., Beekman,J.M., Kessler,D.J., Murphy,M., Jayaraman,K., Zendegui,J.G., Hogan,M.E., O’Malley,B.W. and Tsai,M.J. (1993) Nucleic Acids Res., 21, 2789–2796. - PMC - PubMed
    1. Kovacs A., Kandala,J.C., Weber,K.T. and Guntaka,R.V. (1996) J. Biol. Chem., 271, 1805–1812. - PubMed
    1. Svinarchuk F., Debin,A., Bertrand,J.R. and Malvy,C. (1996) Nucleic Acids Res., 24, 295–302. - PMC - PubMed
    1. Kochetkova M. and Shannon,M.F. (1996) J. Biol. Chem., 271, 14438–14444. - PubMed

Publication types

MeSH terms