. 2000 Nov 1;28(21):4306-16.
doi: 10.1093/nar/28.21.4306.

Characterization of the interaction between alphaCP(2) and the 3'-untranslated region of collagen alpha1(I) mRNA

Affiliations

Characterization of the interaction between alphaCP(2) and the 3'-untranslated region of collagen alpha1(I) mRNA

J N Lindquist et al. Nucleic Acids Res. .

Abstract

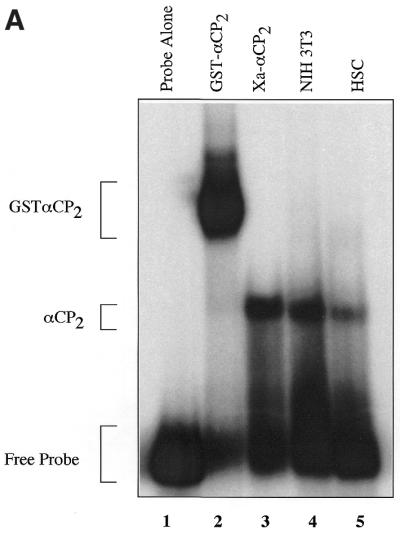
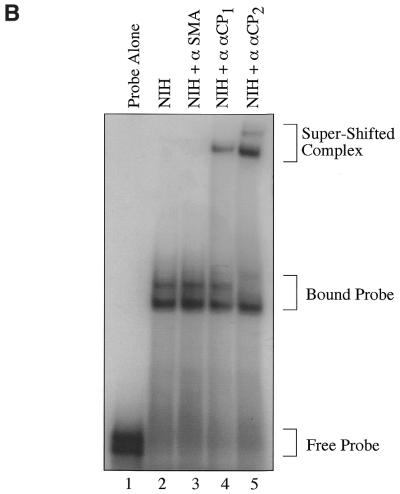
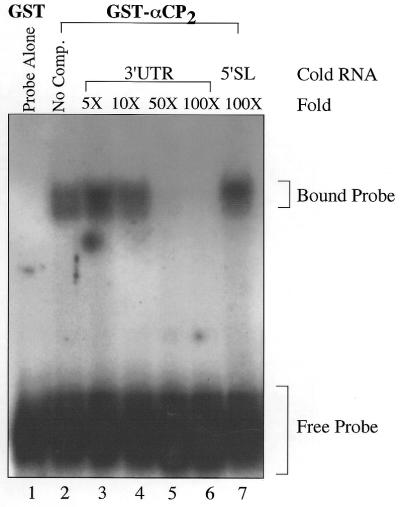
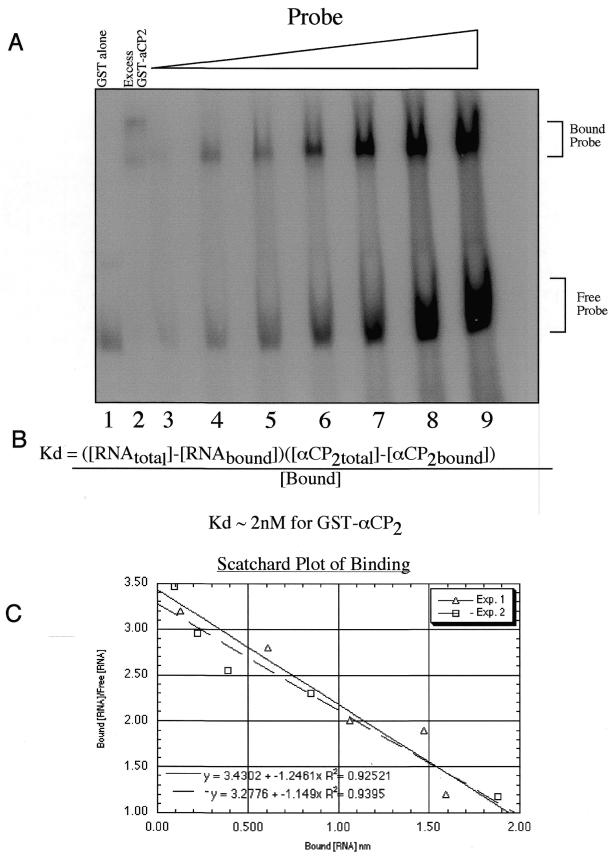
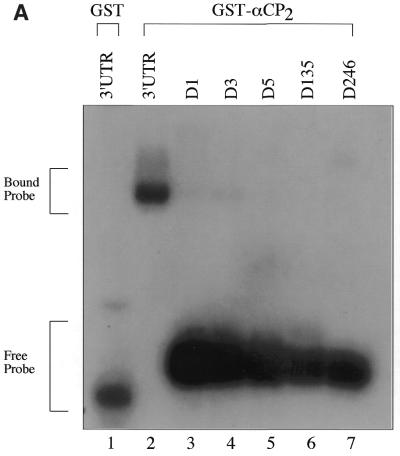
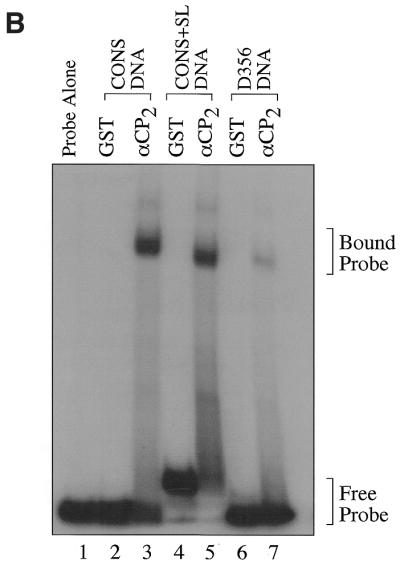
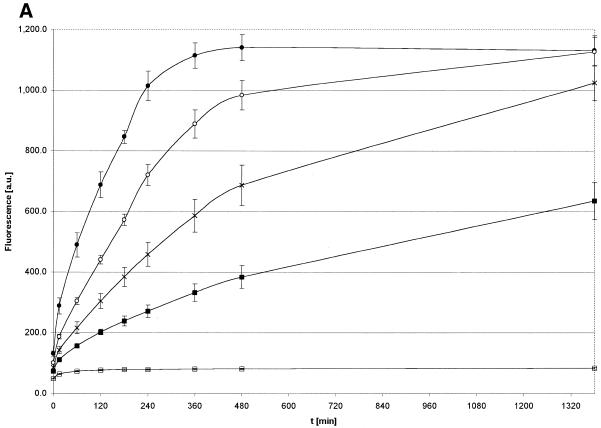
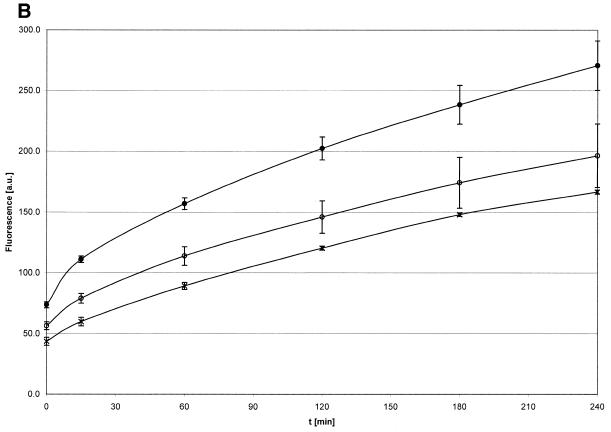
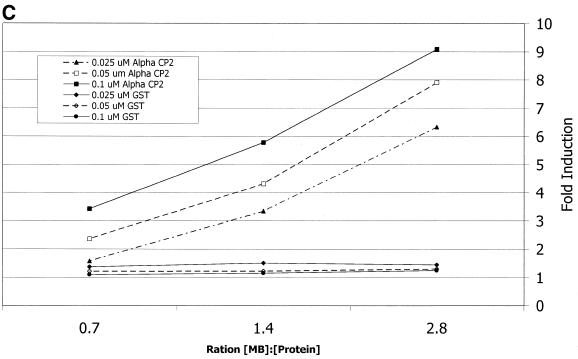
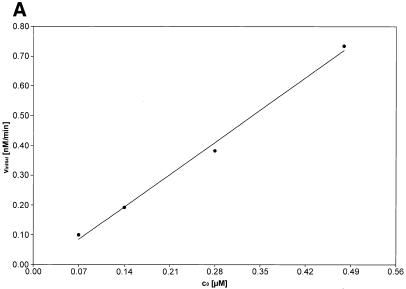
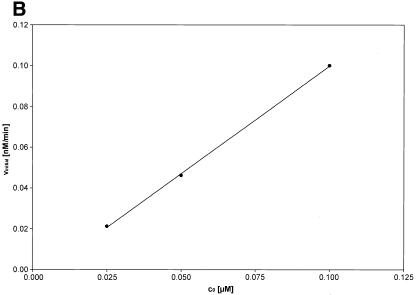
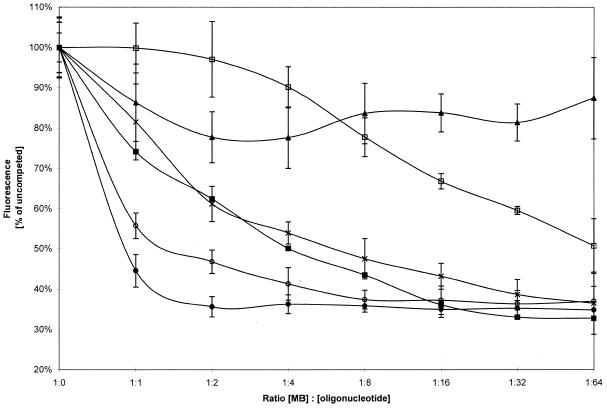
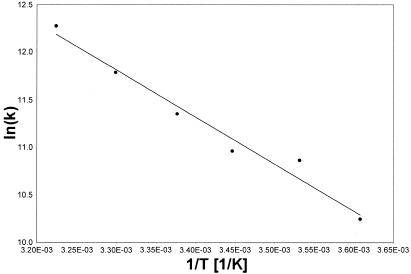
Activated hepatic stellate cells produce increased type I collagen in hepatic fibrosis. The increase in type I collagen protein results from an increase in mRNA levels that is mainly mediated by increased mRNA stability. Protein-RNA interactions in the 3'-UTR of the collagen alpha1(I) mRNA correlate with stabilization of the mRNA during hepatic stellate cell activation. A component of the binding complex is alphaCP(2). Recombinant alphaCP(2) is sufficient for binding to the 3'-UTR of collagen alpha1(I). To characterize the binding affinity of and specificity for alphaCP(2), we performed electrophoretic mobility shift assays using the poly(C)-rich sequence in the 3'-UTR of collagen alpha1(I) as probe. The binding affinity of alphaCP(2) for the 3'-UTR sequence is approximately 2 nM in vitro and the wild-type 3' sequence binds with high specificity. Furthermore, we demonstrate a system for detecting protein-nucleotide interactions that is suitable for high throughput assays using molecular beacons. Molecular beacons, developed for DNA-DNA hybridization, are oligonucleotides with a fluorophore and quencher brought together by a hairpin sequence. Fluorescence increases when the hairpin is disrupted by binding to an antisense sequence or interaction with a protein. Molecular beacons displayed a similar high affinity for binding to recombinant alphaCP(2) to the wild-type 3' sequence, although the kinetics of binding were slower.


Figures

Figure 1
Figure 1
αCP2 binds to the collagen α1(I) 3′-UTR. (A) In vitro transcribed RNA labeled by [α-32P]UTP incorporation was incubated with either no extract (lane 1), 40 ng recombinant GST–αCP2 (lane 2), 20 ng recombinant Factor Xa-cleaved GST–αCP2 (lane 3), 10 µg NIH 3T3 cytoplasmic lysate (lane 4) or 10 µg cytoplasmic lysate from activated human hscs (lane 5). The extracts were incubated on ice for 30 min with 11 000 c.p.m. (∼10 pmol) of probe in a total volume of 25 µl and electrophoresed on a 6% native acrylamide gel. The gel was dried and exposed to film. (B) Specific antibodies were used to supershift αCP1 (lane 4) or αCP2 (lane 5), while an antibody to smooth muscle actin did not cause a shift (lane 3). Binding reactions were done as in (A). Antibodies were generous gifts from R. Andino and M. Czyzyk-Krzeska.
Figure 1
Figure 1
αCP2 binds to the collagen α1(I) 3′-UTR. (A) In vitro transcribed RNA labeled by [α-32P]UTP incorporation was incubated with either no extract (lane 1), 40 ng recombinant GST–αCP2 (lane 2), 20 ng recombinant Factor Xa-cleaved GST–αCP2 (lane 3), 10 µg NIH 3T3 cytoplasmic lysate (lane 4) or 10 µg cytoplasmic lysate from activated human hscs (lane 5). The extracts were incubated on ice for 30 min with 11 000 c.p.m. (∼10 pmol) of probe in a total volume of 25 µl and electrophoresed on a 6% native acrylamide gel. The gel was dried and exposed to film. (B) Specific antibodies were used to supershift αCP1 (lane 4) or αCP2 (lane 5), while an antibody to smooth muscle actin did not cause a shift (lane 3). Binding reactions were done as in (A). Antibodies were generous gifts from R. Andino and M. Czyzyk-Krzeska.
Figure 2
Figure 2
Binding of the 3′-UTR is competed by cold 3′-UTR RNA. In this experiment 20 ng GST–αCP2 was incubated with 15 000 c.p.m. (15 pmol) of radiolabeled RNA. Cold RNA, at the indicated fold excess, was added just prior to incubation with the radiolabeled probe and the reaction mixture kept on ice for 30 min prior to electrophoresis on a 6% native gel. The addition of cold 3′-UTR in excess competed with binding of the radiolabeled probe (lanes 2–6). Addition of 100-fold excess of an unrelated sequence (lane 7) had no effect on binding, indicating a specific interaction of GST–αCP2 with the 3′-UTR.
Figure 3
Figure 3
Recombinant GST–αCP2 binds the 3′-UTR with a Kd of 2.1 nM. Recombinant GST–αCP2 was incubated at a constant amount, between 1 and 4 pmol, with increasing amounts of radiolabeled RNA probe added to the incubation mixture to determine the Kd of GST–αCP2 binding. (A) In lane 2, 44 pmol αCP2 was added to ensure that all the probe was active or able to be bound, while only 4.4 pmol αCP2 was used in lanes 3–9. In lanes 1 and 2, 5 pmol radiolabeled RNA was used and in lane 3, 2.5 pmol was used. Then the amount of probe was increased to 5, 7.5, 15, 30, 46 and 60 pmol in lanes 4–9, respectively. The samples were run on a 6% native gel, dried and exposed on a PhosphoImager cassette and quantitated. (B) The equation shown was used in non-linear regression to determine the Kd of αCP2 with the 3′-UTR of collagen α1(I) (19). Several gels were quantitated and analyzed separately and averaged to determine a Kd of 2.1 nM for αCP2. (C) A Scatchard analysis of two representative gels was performed. Non-linear analysis was preferred to Scatchard analysis and this value was used for final determination of the Kd.
Figure 4
Figure 4
GST–αCP2 specifically binds 3′-UTR DNA sequences. (A) RNA sequences containing point mutations in the C triplets present in the 3′-UTR were generated as described in Materials and Methods. These were used in EMSA reactions to determine if the base changes affected binding of αCP2. The point mutations resulted in a >95% decrease in binding by αCP2, indicating a very high sequence specificity in the EMSA reactions. (B) Radiolabeled DNA was synthesized by phosphorylating 200 ng ssDNA using polynucleotide kinase and [γ-32P]ATP. The probes were gel purified and 15 000 c.p.m. were used per reaction. The 3′-UTR DNA binds specifically to GST–αCP2 (lanes 2 and 3). The addition of a stem–loop sequence to the ends of the 3′-UTR sequence did not affect binding to GST–αCP2 (lanes 4 and 5). Mutations in three of the C triplet repeats caused an 80% reduction in binding the DNA (lanes 6 and 7).
Figure 4
Figure 4
GST–αCP2 specifically binds 3′-UTR DNA sequences. (A) RNA sequences containing point mutations in the C triplets present in the 3′-UTR were generated as described in Materials and Methods. These were used in EMSA reactions to determine if the base changes affected binding of αCP2. The point mutations resulted in a >95% decrease in binding by αCP2, indicating a very high sequence specificity in the EMSA reactions. (B) Radiolabeled DNA was synthesized by phosphorylating 200 ng ssDNA using polynucleotide kinase and [γ-32P]ATP. The probes were gel purified and 15 000 c.p.m. were used per reaction. The 3′-UTR DNA binds specifically to GST–αCP2 (lanes 2 and 3). The addition of a stem–loop sequence to the ends of the 3′-UTR sequence did not affect binding to GST–αCP2 (lanes 4 and 5). Mutations in three of the C triplet repeats caused an 80% reduction in binding the DNA (lanes 6 and 7).
Figure 5
Figure 5
Hyperchromism curves of the MB and S40 sequences. The MB and S40 oligonucleotides were dissolved in reaction buffer at a concentration of 1 OD (260 nm) in heated 100 µl quartz cuvettes. Temperature was increased in 5 K steps and the absorbance at 260 nm recorded. MB, filled circle; S40, open circle.
Figure 6
Figure 6
Kinetics of the αCP2–MB interaction. The kinetics of the fluorescent reaction at 37°C at constant concentrations of either molecular beacon (A) or αCP2 (B). (A) Molecular beacon (0.1 µM) and different concentrations of αCP2 (filled circle, 0.56 µM; open circle, 0.28 µM; cross, 0.14 µM; filled box, 0.07 µM; open box, 0 µM). The reaction was slow, with maximum fluorescence reached after ∼20 h. (B) αCP2 (0.07 µM) and different concentrations of molecular beacon (filled circle, 0.1 µM; open circle, 0.05 µM; cross, 0.025 µM). (C) GST and αCP2 were used with a constant MB concentration to assess non-specific protein–MB interactions. There was no increase with GST alone, indicating that the fluorescence is due to a specific interaction between αCP2 and the MB sequence. The concentration of MB is noted in the figure; the data points were all taken at 480 min, under the conditions described in Materials and Methods.
Figure 6
Figure 6
Kinetics of the αCP2–MB interaction. The kinetics of the fluorescent reaction at 37°C at constant concentrations of either molecular beacon (A) or αCP2 (B). (A) Molecular beacon (0.1 µM) and different concentrations of αCP2 (filled circle, 0.56 µM; open circle, 0.28 µM; cross, 0.14 µM; filled box, 0.07 µM; open box, 0 µM). The reaction was slow, with maximum fluorescence reached after ∼20 h. (B) αCP2 (0.07 µM) and different concentrations of molecular beacon (filled circle, 0.1 µM; open circle, 0.05 µM; cross, 0.025 µM). (C) GST and αCP2 were used with a constant MB concentration to assess non-specific protein–MB interactions. There was no increase with GST alone, indicating that the fluorescence is due to a specific interaction between αCP2 and the MB sequence. The concentration of MB is noted in the figure; the data points were all taken at 480 min, under the conditions described in Materials and Methods.
Figure 7
Figure 7
Initial velocities of the αCP2–MB interaction. (A) The initial velocities (vinitial) of the association reaction at 37°C at a constant concentration of molecular beacon (0.1 µM) and different concentrations of αCP2 (0.48, 0.28, 0.14 and 0.07 µM). vinitial is proportional to the concentration of αCP2. (B) The initial velocities (vinitial) of the association reaction at 37°C at constant concentrations of αCP2 (0.07 µM) and different concentrations of molecular beacon (0.1, 0.05 and 0.025 µM). vinitial is proportional to the concentration of molecular beacon.
Figure 7
Figure 7
Initial velocities of the αCP2–MB interaction. (A) The initial velocities (vinitial) of the association reaction at 37°C at a constant concentration of molecular beacon (0.1 µM) and different concentrations of αCP2 (0.48, 0.28, 0.14 and 0.07 µM). vinitial is proportional to the concentration of αCP2. (B) The initial velocities (vinitial) of the association reaction at 37°C at constant concentrations of αCP2 (0.07 µM) and different concentrations of molecular beacon (0.1, 0.05 and 0.025 µM). vinitial is proportional to the concentration of molecular beacon.
Figure 8
Figure 8
Inhibitory oligonucleotides compete with the molecular beacon. Inhibition of fluorescence increases with addition of different oligonucleotides. αCP2, at a concentration of 0.05 µM, was preincubated overnight with various excesses of sense DNA oligonucleotides [filled circle, poly(C); open circle, S33; cross, S28; filled box, S40; open box, mutant 2; filled triangle, poly(G)] from a 64-fold excess over αCP2 to equimolar ratios.
Figure 9
Figure 9
Activation energy of αCP2–MB binding. An Arrhenius plot of the kinetics was drawn from data obtained at different temperatures. The slope of the graph was –4934.3 K, indicative of an activation energy of ∼41 kJ/mol for the αCP2–MB interaction.

References

    1. Friedman S.L. (2000) J. Biol. Chem., 275, 2247–2250. - PubMed
    1. Brenner D.A., Waterboer,T., Choi,S.K., Lindquist,J.N., Stefanovic,B., Burchardt,E., Yamauchi,M., Gillan,A. and Rippe,R.A. (2000) J. Hepatol., 32 (suppl. 1), 32–38. - PubMed
    1. Stefanovic B., Hellerbrand,C., Holcick,M., Briendl,M., Liebhaber,S. and Brenner,D.A. (1997) Mol. Cell. Biol., 17, 5201–5209. - PMC - PubMed
    1. Kiledjian M., Wong,X. and Liebhaber,S. (1995) EMBO J., 14, 4357–4364. - PMC - PubMed
    1. Wang X., Kiledijan,M., Weiss,I. and Liebhaber,S. (1995) Mol. Cell. Biol., 15, 1769–1777. - PMC - PubMed

MeSH terms