

Structure of a covalently stabilized complex of a human alphabeta T-cell receptor, influenza HA peptide and MHC class II molecule, HLA-DR1
- PMID: 11060013
- PMCID: PMC305780
- DOI: 10.1093/emboj/19.21.5611
Structure of a covalently stabilized complex of a human alphabeta T-cell receptor, influenza HA peptide and MHC class II molecule, HLA-DR1
Abstract
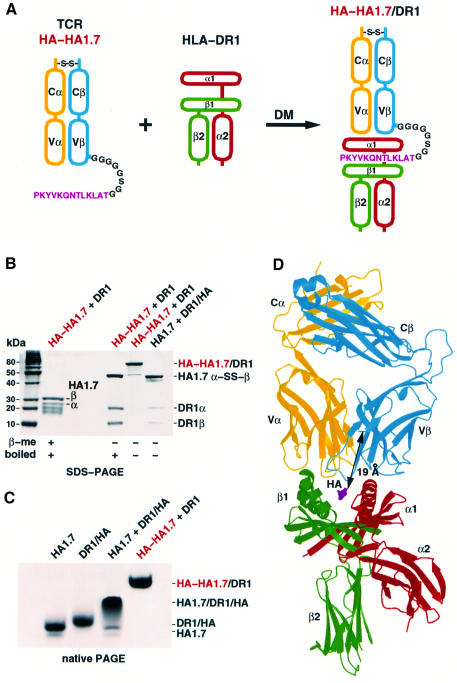
An alphabeta T-cell receptor (alphabetaTCR)/hemagglutinin (HA) peptide/human leukocyte antigen (HLA)-DR1 complex was stabilized by flexibly linking the HA peptide with the human HA1.7 alphabetaTCR, to increase the local concentration of the interacting proteins once the peptide has been loaded onto the major histocompatibility complex (MHC) molecule. The structure of the complex, determined by X-ray crystallography, has a binding mode similar to that of the human B7 alphabetaTCR on a pMHCI molecule. Twelve of the 15 MHC residues contacted are at the same positions observed earlier in class I MHC/peptide/TCR complexes. One contact, to an MHC loop outside the peptide-binding site, is conserved and specific to pMHCII complexes. TCR gene usage in the response to HA/HLA-DR appears to conserve charged interactions between three lysines of the peptide and acidic residues on the TCR.
Figures
Similar articles
-
Structure of a complex of the human alpha/beta T cell receptor (TCR) HA1.7, influenza hemagglutinin peptide, and major histocompatibility complex class II molecule, HLA-DR4 (DRA*0101 and DRB1*0401): insight into TCR cross-restriction and alloreactivity.J Exp Med. 2002 Mar 4;195(5):571-81. doi: 10.1084/jem.20011194. J Exp Med. 2002. PMID: 11877480 Free PMC article.
-
A recombinant single-chain human class II MHC molecule (HLA-DR1) as a covalently linked heterotrimer of alpha chain, beta chain, and antigenic peptide, with immunogenicity in vitro and reduced affinity for bacterial superantigens.Eur J Immunol. 1997 Aug;27(8):1933-41. doi: 10.1002/eji.1830270817. Eur J Immunol. 1997. PMID: 9295029
-
Crystal structure of the human class II MHC protein HLA-DR1 complexed with an influenza virus peptide.Nature. 1994 Mar 17;368(6468):215-21. doi: 10.1038/368215a0. Nature. 1994. PMID: 8145819
-
Labeling antigen-specific CD4(+) T cells with class II MHC oligomers.J Immunol Methods. 2002 Oct 1;268(1):51-69. doi: 10.1016/s0022-1759(02)00200-4. J Immunol Methods. 2002. PMID: 12213343 Review.
-
Not just another Fab: the crystal structure of a TcR-MHC-peptide complex.Structure. 1997 Feb 15;5(2):159-63. doi: 10.1016/s0969-2126(97)00175-5. Structure. 1997. PMID: 9032079 Review.
Cited by
-
The DY genes of the cattle MHC: expression and comparative analysis of an unusual class II MHC gene pair.Immunogenetics. 2004 Feb;55(11):748-55. doi: 10.1007/s00251-004-0641-x. Epub 2004 Jan 24. Immunogenetics. 2004. PMID: 14745522
-
Alternate interactions define the binding of peptides to the MHC molecule IA(b).Proc Natl Acad Sci U S A. 2002 Jun 25;99(13):8820-5. doi: 10.1073/pnas.132272099. Proc Natl Acad Sci U S A. 2002. PMID: 12084926 Free PMC article.
-
Interference with T cell receptor-HLA-DR interactions by Epstein-Barr virus gp42 results in reduced T helper cell recognition.Proc Natl Acad Sci U S A. 2003 Sep 30;100(20):11583-8. doi: 10.1073/pnas.2034960100. Epub 2003 Sep 22. Proc Natl Acad Sci U S A. 2003. PMID: 14504389 Free PMC article.
-
Characterization of the MHC class II α-chain gene in ducks.Immunogenetics. 2011 Oct;63(10):667-78. doi: 10.1007/s00251-011-0545-5. Epub 2011 Jun 10. Immunogenetics. 2011. PMID: 21660591
-
Surface-anchored monomeric agonist pMHCs alone trigger TCR with high sensitivity.PLoS Biol. 2008 Feb;6(2):e43. doi: 10.1371/journal.pbio.0060043. PLoS Biol. 2008. PMID: 18303949 Free PMC article.
References
-
- Acha-Orbea H., Mitchell,D.J., Timmermann,L., Wraith,D.C., Tausch,G.S., Waldor,M.K., Zamvil,S.S., McDevitt,H.O. and Steinman,L. (1988) Limited heterogeneity of T cell receptors from lymphocytes mediating autoimmune encephalomyelitis allows specific immune intervention. Cell, 54, 263–273. - PubMed
-
- Alexander J. et al. (1993) Functional consequences of engagement of the T cell receptor by low affinity ligands. J. Immunol., 150, 1–7. - PubMed
-
- Anderson D.E., Becktel,W.J. and Dahlquist,F.W. (1990) pH-induced denaturation of proteins: a single salt bridge contributes 3–5 kcal/mol to the free energy of folding of T4 lysozyme. Biochemistry, 29, 2403–2408. - PubMed
-
- Arden B., Clark,S.P., Kabelitz,D. and Mak,T.W. (1995) Human T-cell receptor variable gene segment families. Immunogenetics, 42, 455–500. - PubMed
-
- Baker B.M., Ding,Y.-H., Garboczi,D.N., Biddison,W.E. and Wiley,D.C. (1999) Structural, biochemical and biophysical studies of HLA-A2/altered peptide ligands binding to viral-peptide-specific human T-cell receptors. Cold Spring Harb. Symp. Quant. Biol., 64, 235–241. - PubMed
Publication types
MeSH terms
Substances
LinkOut - more resources
Full Text Sources
Other Literature Sources
Molecular Biology Databases
Research Materials
