. 2000 Nov 1;19(21):5729-39.
doi: 10.1093/emboj/19.21.5729.

The endoplasmic reticulum as one continuous Ca(2+) pool: visualization of rapid Ca(2+) movements and equilibration

Affiliations

The endoplasmic reticulum as one continuous Ca(2+) pool: visualization of rapid Ca(2+) movements and equilibration

M K Park et al. EMBO J. .

Abstract

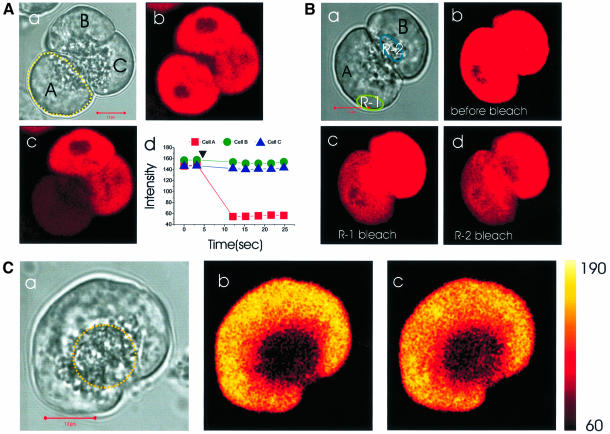
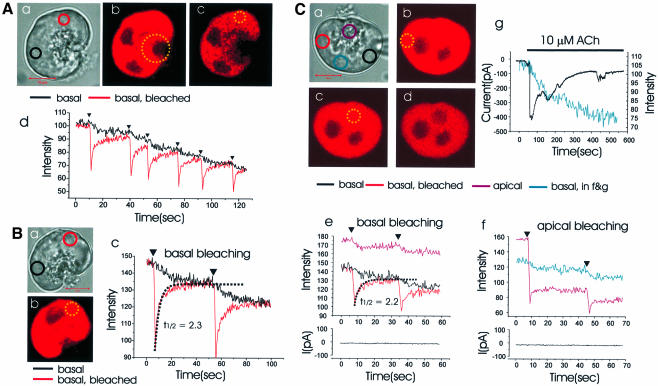
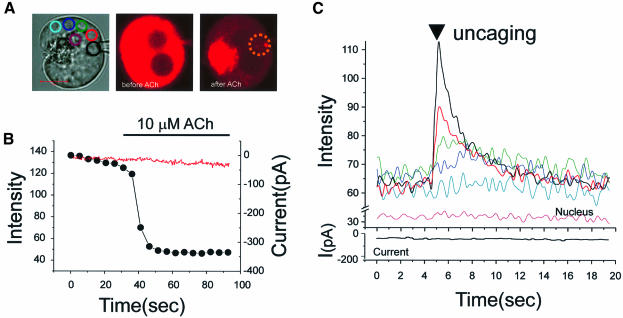
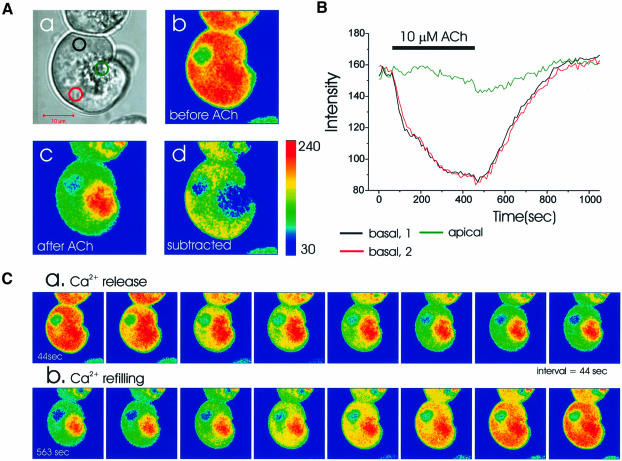
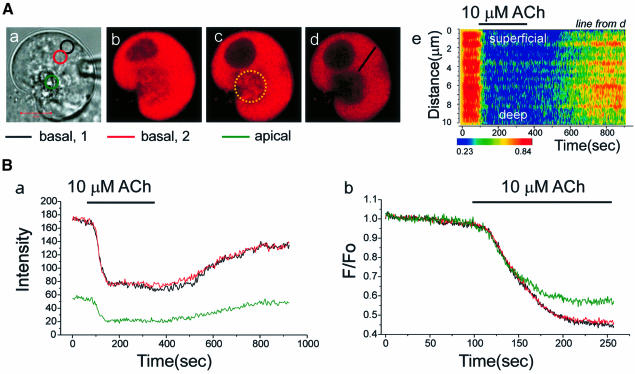
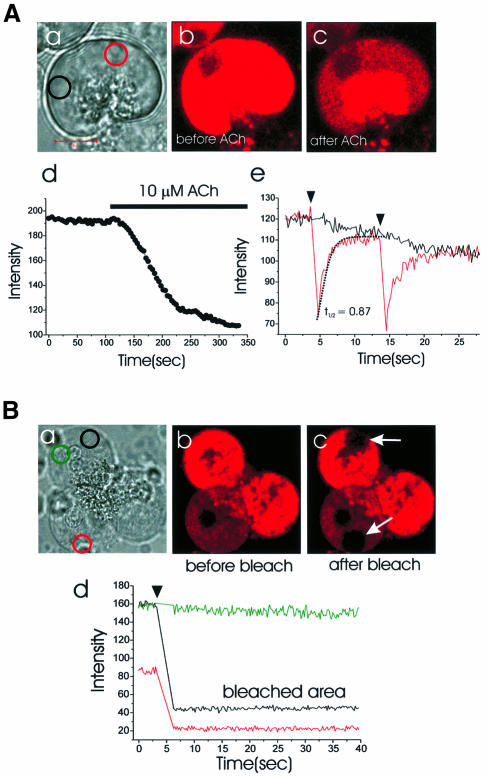
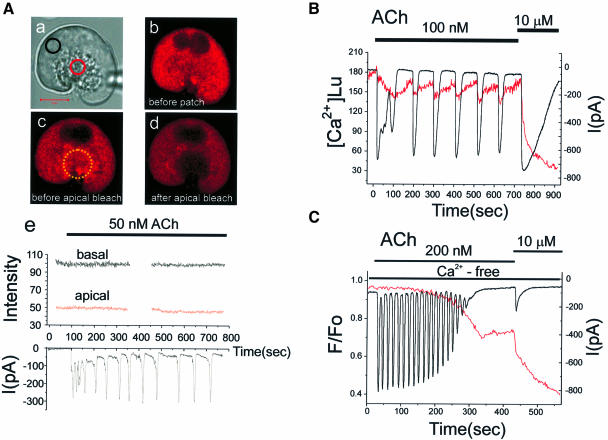
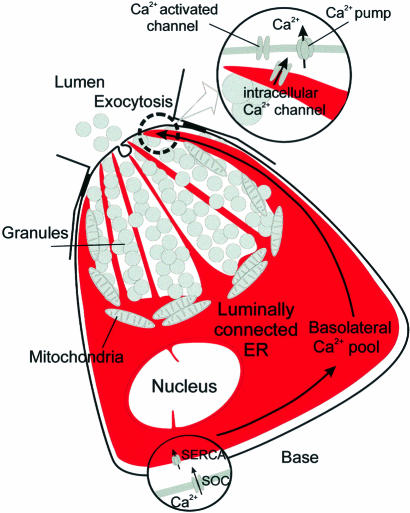
We investigated whether the endoplasmic reticulum (ER) is a functionally connected Ca(2+) store or is composed of separate subunits by monitoring movements of Ca(2+) and small fluorescent probes in the ER lumen of pancreatic acinar cells, using confocal microscopy, local bleaching and uncaging. We observed rapid movements and equilibration of Ca(2+) and the probes. The bulk of the ER at the base was not connected to the granules in the apical part, but diffusion into small apical ER extensions occurred. The connectivity of the ER Ca(2+) store was robust, since even supramaximal acetylcholine (ACh) stimulation for 30 min did not result in functional fragmentation. ACh could elicit a uniform decrease in the ER Ca(2+) concentration throughout the cell, but repetitive cytosolic Ca(2+) spikes, induced by a low ACh concentration, hardly reduced the ER Ca(2+) level. We conclude that the ER is a functionally continuous unit, which enables efficient Ca(2+) liberation. Ca(2+) released from the apical ER terminals is quickly replenished from the bulk of the rough ER at the base.


Figures

None
Fig. 1. The full connectivity of the whole basolateral ER Ca2+ store complex and the connection with the apical extensions is demonstrated by local photobleaching of Mag-fluo 4 in the lumen of the ER and subsequent monitoring of the movement of unbleached dye. (A) One cell [yellow dotted circle in (a)] was selectively bleached with UV laser; (b and c) show fluorescence images before and after bleaching; (d) measurement of fluorescence intensity changes in the three cells. (B) Repetitive local bleaching [R-1 in (a)] resulted in a homogeneous decrease of fluorescence intensity throughout the whole basolateral part of the cell (b and c, before and after bleaching), indicating that the whole basolaterally located Ca2+ store was fully interconnected. By contrast, local apical bleaching [R-2 in (a)] affected only the bleached part of the cell (d), suggesting that the granular Ca2+ store was not functionally connected to the basolateral ER. (C) After wide apical bleaching [yellow dotted circle in (a)], we monitored the fluorescence intensity changes in the apical and basal pole: (a) transmitted light picture; (b) fluorescence image taken immediately after apical bleaching; (c) 15 s after the bleaching. The length of the horizontal red bar in A(a), B(a) and C(a) represents 10 μm.
None
Fig. 2. Time course of Mag-fluo 4 movement in the ER lumen following local bleaching. (A) (a) Transmitted light picture of a single cell with the areas of interest identified by the red and black circles. Length of red bar corresponds to 10 µm. (b and c) Fluorescence intensity images before and after wide apical bleach in region marked by large yellow dotted circle in (b). Local basal bleaching [small yellow dotted circle in (c)] was applied repeatedly and the fluorescence intensities measured both in the bleached area [red circle in (a), red curve in (d)] as well as in an unbleached basal area ∼10 µm away [black circle in (a), black curve in (d)]. (B) (a) Transmitted light picture of another cell. Local basal bleaching [red and yellow dotted circles in (a) and (b), respectively] was applied and the fluorescence intensity changes in the marked sites [colour coding corresponds to coloured circles in (a)] are shown in (c). (C) In this experiment Mag-fluo 4 was washed out of the cytosol through a patch pipette (a) (whole-cell configuration). Ten minutes after establishing whole-cell configuration, the areas represented by the dotted yellow circles (b and c) were bleached and the fluorescence intensity changes monitored in the areas represented by the marked circles in (a). (a) Transmitted light picture; (b and c) before and after basal bleaching, respectively; (c and d) before and after apical bleaching. The time course of the changes in fluorescence intensity [colour coding according to the marked sites in (a)] and the Ca2+-dependent whole-cell current during the local basal (b) and apical (c) bleaching are shown in (e) and (f), respectively. After the bleaching experiments, ACh elicited an increase in the Ca2+-dependent current (black trace) and released Ca2+ from the ER (blue trace) (g).
None
Fig. 3. Rapid movement of Ca2+ in the ER lumen following local uncaging of caged Ca2+. Direct measurement of Ca2+ movement in the lumen ofthe ER. After 30 min loading with Mag-fluo 4-AM and NP-EGTA-AM, the dye and NP-EGTA were washed out of the cytosol into a patch pipette (whole-cell configuration). The cytosolic Ca2+ was clamped at the resting level by using a patch pipette containing 10 mM BAPTA and 2 mM Ca2+. Thereafter, 10 µM ACh was applied to lower the Ca2+ concentration inside the ER. (A) Transmitted light image of the cell with the patch pipette. The various regions of interest are colour coded. The fluorescence intensity images just before and after ACh application are also shown. NP-EGTA was uncaged in the lumen of the ER in the area represented by the dotted circle. (B) Time course of the ACh-evoked reduction in Ca2+ concentration inside the ER (black dots) and also the complete absence of any change in the Ca2+-dependent Cl current (red trace). (C) Time course of the Ca2+ concentration changes in the ER, following local uncaging, in the various regions colour coded in (A). It is also seen that the Ca2+-dependent current did not change after the intralumenal uncaging.
None
Fig. 4. Time course of ACh-evoked Ca2+ release and the subsequent refilling of the ER. In a Mag-fluo 4-loaded cell, 10 µM ACh was applied. (A) (a) Transmitted light picture; (b and c) fluorescence intensity images before and after ACh; (d) subtracted image (b–c). (B) Time course of ACh-induced fluorescence intensity changes in the two basal as well as the apical regions marked in [A(a)]. (C) Time course of Ca2+ release following ACh stimulation and subsequent refilling after cessation of stimulation.
None
Fig. 5. Ca2+ release from the ER after ACh stimulation follows the same time course in the basal and apical regions. Mag-fluo 4-loaded cell with subsequent washout of cytosolic dye component through patch pipette in whole-cell configuration. Cytosolic Ca2+ concentration clamped at the normal resting level by BAPTA/Ca2+ mixture. (A) (a) Transmitted light picture; (b) fluorescence intensity image before cytosolic dye washout; (c) 10 min after establishment of whole-cell configuration. Thereafter wide apical bleaching of apical pole within area represented by dotted yellow circle. (d) After apical bleaching to remove fluorescence from dye in the granules. (e) Line scan image taken from the line shown in (d) illustrating the time course of the Ca2+ concentration changes in the ER at the base of the cell. (B) (a) Ca2+-dependent fluorescence intensity changes in response to ACh measured in the three areas represented by the colour-coded circles in [A(a)]. (b) Comparison of Ca2+ release time in the apical and basal parts of the cell with a fast scan mode (89 ms sampling).
None
Fig. 6. Supramaximal ACh stimulation fails to fragment the ER, but prolonged exposure to ionomycin in the presence of 10 mM extracellular Ca2+ abolishes lumenal diffusion of Mag-fluo 4. Local bleach experiments were carried out after application of 10 µM ACh (A) and 15 µM ionomycin (B). (A) (a) Transmitted light image of the cell investigated; (b and c) fluorescence images before and after ACh application; (d) ER Ca2+ release after 10 µM ACh; (e) a small area in the basal part [red circle in (a)] was bleached and the fluorescence intensity measured at the bleached site (red curve) and a remote site [black circle in (a) and black curve]. Half recovery time is 0.9 s. (B) Local bleaching experiment after 15 min treatment with 15 µM ionomycin in 10 mM Ca2+. We observed lumenal connectivity until 10 min after 10 µM ionomycin treatment; however, after ∼12 min,the ER appeared to be fragmented. After bleaching two local areas [marked as black and red circles in (a)], there was no recovery of fluorescence intensity (arrows). (a) Transmitted light image of thecells investigated; (b) fluorescence intensity image before bleaching; (c) fluorescence intensity image after bleaching of two local areas (arrows); (d) fluorescence intensities measured at the sites marked by the correspondingly coloured sites in (a).
None
Fig. 7. Repetitive short-lasting cytosolic Ca2+ spikes evoked by a low ACh concentration are associated with no or very small changes in the Ca2+ concentration inside the ER. (A) (a) Transmitted light picture of the cell investigated, with the two regions of interest identified by the coloured circles. The fluorescence intensity images before (b) and after (c) the establishment of the patch–clamp whole-cell recording configuration as well as after the apical bleaching (d) are shown. (e) The Ca2+-sensitive fluorescence intensity from Mag-fluo 4 inside the ER before and during stimulation with 50 nM ACh in both the basal and apical regions (upper part) as well as the Ca2+-dependent whole-cell current (lower part). (B) 100 nM ACh generated more substantial Ca2+-dependent current oscillations close to the maximal activation of the current with 10 µM ACh. In this particular cell, we observed small decreases in the Ca2+ concentration of the ER, recorded using the ratiometric dye Mag-fura 2 (351 and 364 nm excitation) and calibrated as described previously (Park et al., 1999). (C) Measurement of the ER Ca2+ concentration (Mag-fluo 4) and the Ca2+-dependent current oscillations in a cell exposed to an external Ca2+-free solution. In Ca2+-free solutions, low doses of ACh (25–100 nM) failed to evoke Ca2+ oscillations and 200 nM ACh had to be used to generate repetitive cytosolic Ca2+ spikes. Individual short-lasting Ca2+-dependent current spikes were not associated with any measurable drop in the Ca2+ concentration in the ER store, but after ∼2 min of repetitive spiking the ER Ca2+ concentration began to decrease. As the ER was losing Ca2+, the spikes became smaller and finally disappeared. After the Ca2+ oscillations had ceased, there was a further decrease in the ER Ca2+ concentration during a period of non-oscillatory elevation in the cytosolic Ca2+ concentration. Finally, a supramaximal ACh (10 µM) application caused a marked further Ca2+ release from the ER.
None
Fig. 8. Simplified schematic model illustrating that the whole of the basal ER is functionally connected and also that this compartment is connected to thin extensions deep into the apical granular pole. The bulk of the intracellular Ca2+ pool is located in the basal part of the cell. During agonist stimulation Ca2+ is released primarily from the thin ER extensions in the apical granular pole, where the Ca2+ release channels are located, but the apical ER elements can recruit Ca2+ from the basal store. SERCA, sarco-endoplasmic reticulum Ca2+-activated ATPase. SOC, store-operated Ca2+ channel.

Similar articles

Cited by

References

    1. Belan P.V., Gerasimenko,O.V., Tepikin,A.V. and Petersen,O.H. (1996) Localization of Ca2+ extrusion sites in pancreatic acinar cells. J. Biol. Chem., 271, 7615–7619. - PubMed
    1. Berridge M.J. (1993) Inositol trisphosphate and calcium signalling. Nature, 361, 315–325. - PubMed
    1. Berridge M.J. and Irvine,R.F. (1989) Inositol phosphates and cell signalling. Nature, 341, 197–205. - PubMed
    1. Bootman M.D., Berridge,M.J. and Taylor,C.W. (1992) All-or-nothing Ca2+ mobilization from the intracellular stores of histamine-stimulated HeLa cells. J. Physiol., 450, 163–178. - PMC - PubMed
    1. Callamaras N. and Parker,I. (2000) Phasic characteristic of elementary Ca2+ release sites underlies quantal responses to IP3. EMBO J., 19, 3608–3617. - PMC - PubMed

Publication types